Sioux vs Haitian Per Capita Income
COMPARE
Sioux
Haitian
Per Capita Income
Per Capita Income Comparison
Sioux
Haitians
$33,921
PER CAPITA INCOME
0.0/ 100
METRIC RATING
332nd/ 347
METRIC RANK
$37,289
PER CAPITA INCOME
0.1/ 100
METRIC RATING
297th/ 347
METRIC RANK
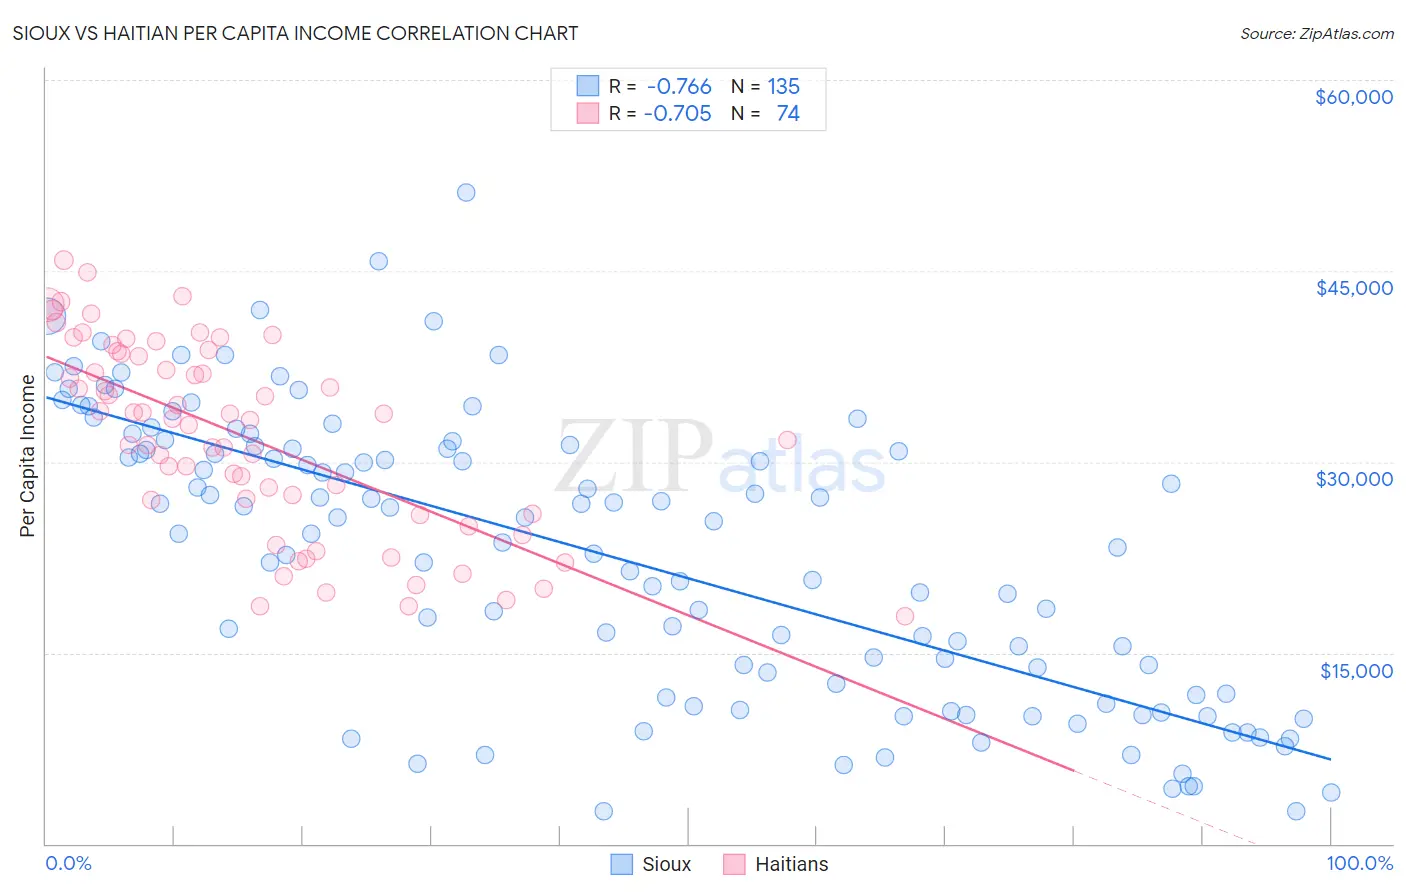
Sioux vs Haitian Per Capita Income Correlation Chart
The statistical analysis conducted on geographies consisting of 234,205,555 people shows a strong negative correlation between the proportion of Sioux and per capita income in the United States with a correlation coefficient (R) of -0.766 and weighted average of $33,921. Similarly, the statistical analysis conducted on geographies consisting of 288,031,086 people shows a strong negative correlation between the proportion of Haitians and per capita income in the United States with a correlation coefficient (R) of -0.705 and weighted average of $37,289, a difference of 9.9%.
Per Capita Income Correlation Summary
| Measurement | Sioux | Haitian |
| Minimum | $2,521 | $17,858 |
| Maximum | $51,123 | $45,871 |
| Range | $48,602 | $28,013 |
| Mean | $22,691 | $31,987 |
| Median | $24,396 | $33,320 |
| Interquartile 25% (IQ1) | $11,727 | $25,885 |
| Interquartile 75% (IQ3) | $31,249 | $38,541 |
| Interquartile Range (IQR) | $19,522 | $12,656 |
| Standard Deviation (Sample) | $11,145 | $7,480 |
| Standard Deviation (Population) | $11,104 | $7,429 |
Similar Demographics by Per Capita Income
Demographics Similar to Sioux by Per Capita Income
In terms of per capita income, the demographic groups most similar to Sioux are Immigrants from Mexico ($33,931, a difference of 0.030%), Immigrants from Yemen ($33,696, a difference of 0.67%), Spanish American Indian ($34,195, a difference of 0.81%), Mexican ($34,559, a difference of 1.9%), and Native/Alaskan ($33,279, a difference of 1.9%).
| Demographics | Rating | Rank | Per Capita Income |
| Immigrants | Central America | 0.0 /100 | #325 | Tragic $34,974 |
| Immigrants | Cuba | 0.0 /100 | #326 | Tragic $34,910 |
| Apache | 0.0 /100 | #327 | Tragic $34,886 |
| Menominee | 0.0 /100 | #328 | Tragic $34,578 |
| Mexicans | 0.0 /100 | #329 | Tragic $34,559 |
| Spanish American Indians | 0.0 /100 | #330 | Tragic $34,195 |
| Immigrants | Mexico | 0.0 /100 | #331 | Tragic $33,931 |
| Sioux | 0.0 /100 | #332 | Tragic $33,921 |
| Immigrants | Yemen | 0.0 /100 | #333 | Tragic $33,696 |
| Natives/Alaskans | 0.0 /100 | #334 | Tragic $33,279 |
| Yuman | 0.0 /100 | #335 | Tragic $33,236 |
| Yakama | 0.0 /100 | #336 | Tragic $33,009 |
| Houma | 0.0 /100 | #337 | Tragic $32,996 |
| Arapaho | 0.0 /100 | #338 | Tragic $32,345 |
| Pueblo | 0.0 /100 | #339 | Tragic $32,012 |
Demographics Similar to Haitians by Per Capita Income
In terms of per capita income, the demographic groups most similar to Haitians are Indonesian ($37,300, a difference of 0.030%), Immigrants from Dominican Republic ($37,306, a difference of 0.040%), Immigrants from Caribbean ($37,254, a difference of 0.090%), Cherokee ($37,203, a difference of 0.23%), and Cuban ($37,383, a difference of 0.25%).
| Demographics | Rating | Rank | Per Capita Income |
| Immigrants | Guatemala | 0.1 /100 | #290 | Tragic $37,550 |
| Cajuns | 0.1 /100 | #291 | Tragic $37,527 |
| Immigrants | Micronesia | 0.1 /100 | #292 | Tragic $37,464 |
| Mexican American Indians | 0.1 /100 | #293 | Tragic $37,407 |
| Cubans | 0.1 /100 | #294 | Tragic $37,383 |
| Immigrants | Dominican Republic | 0.1 /100 | #295 | Tragic $37,306 |
| Indonesians | 0.1 /100 | #296 | Tragic $37,300 |
| Haitians | 0.1 /100 | #297 | Tragic $37,289 |
| Immigrants | Caribbean | 0.1 /100 | #298 | Tragic $37,254 |
| Cherokee | 0.1 /100 | #299 | Tragic $37,203 |
| Immigrants | Bahamas | 0.1 /100 | #300 | Tragic $37,193 |
| Ottawa | 0.1 /100 | #301 | Tragic $37,101 |
| Shoshone | 0.1 /100 | #302 | Tragic $37,072 |
| Paiute | 0.1 /100 | #303 | Tragic $37,066 |
| Hondurans | 0.1 /100 | #304 | Tragic $37,031 |