Sioux vs Creek Median Male Earnings
COMPARE
Sioux
Creek
Median Male Earnings
Median Male Earnings Comparison
Sioux
Creek
$45,566
MEDIAN MALE EARNINGS
0.0/ 100
METRIC RATING
322nd/ 347
METRIC RANK
$46,594
MEDIAN MALE EARNINGS
0.0/ 100
METRIC RATING
309th/ 347
METRIC RANK
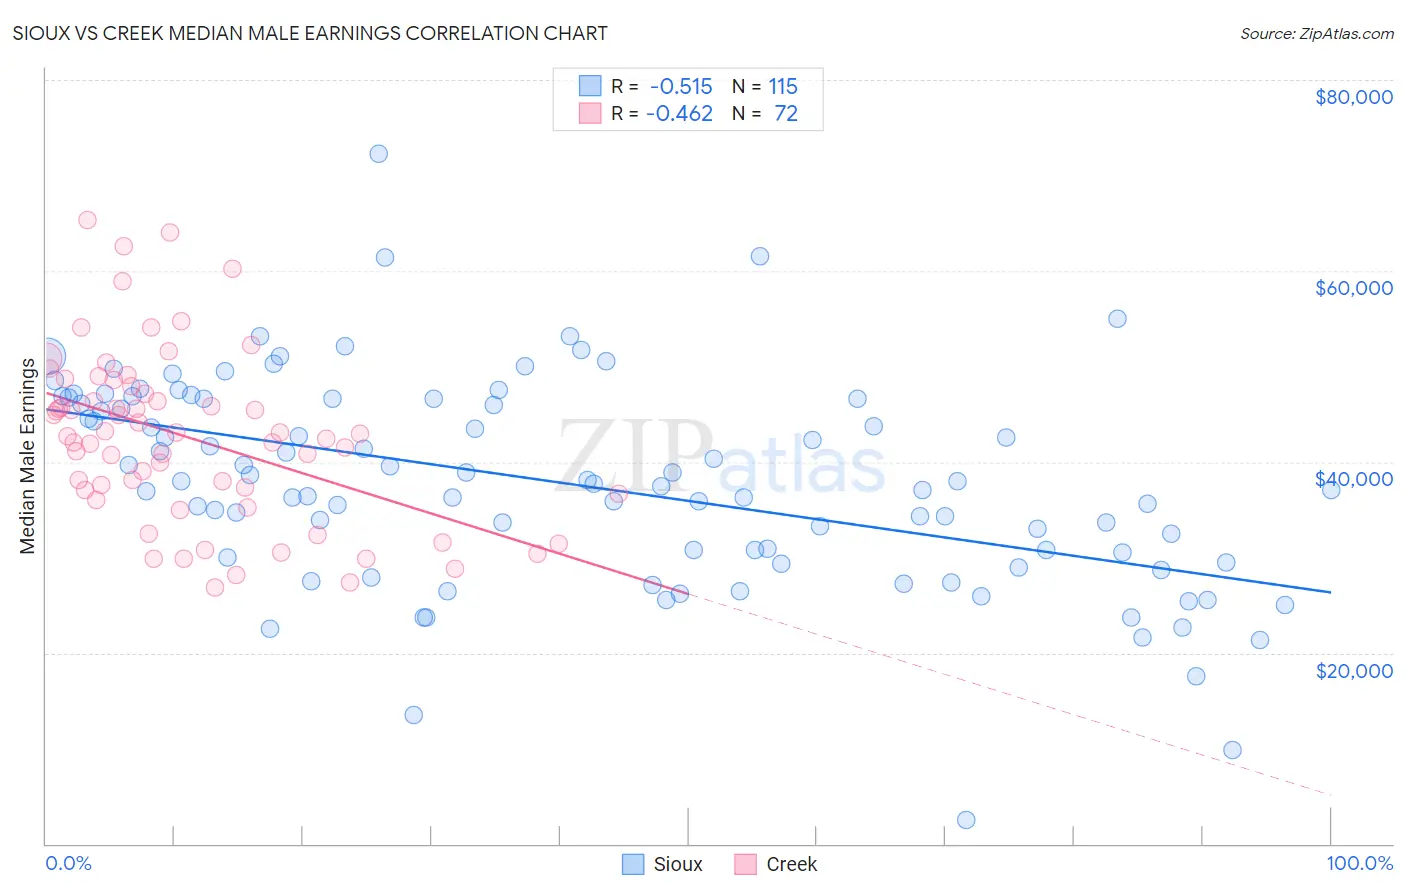
Sioux vs Creek Median Male Earnings Correlation Chart
The statistical analysis conducted on geographies consisting of 234,123,806 people shows a substantial negative correlation between the proportion of Sioux and median male earnings in the United States with a correlation coefficient (R) of -0.515 and weighted average of $45,566. Similarly, the statistical analysis conducted on geographies consisting of 178,430,593 people shows a moderate negative correlation between the proportion of Creek and median male earnings in the United States with a correlation coefficient (R) of -0.462 and weighted average of $46,594, a difference of 2.3%.
Median Male Earnings Correlation Summary
| Measurement | Sioux | Creek |
| Minimum | $2,499 | $26,855 |
| Maximum | $72,273 | $65,299 |
| Range | $69,774 | $38,444 |
| Mean | $37,765 | $42,595 |
| Median | $37,671 | $42,837 |
| Interquartile 25% (IQ1) | $29,938 | $36,835 |
| Interquartile 75% (IQ3) | $46,607 | $47,588 |
| Interquartile Range (IQR) | $16,669 | $10,753 |
| Standard Deviation (Sample) | $10,941 | $8,932 |
| Standard Deviation (Population) | $10,893 | $8,870 |
Demographics Similar to Sioux and Creek by Median Male Earnings
In terms of median male earnings, the demographic groups most similar to Sioux are Immigrants from Central America ($45,538, a difference of 0.060%), Fijian ($45,607, a difference of 0.090%), Black/African American ($45,523, a difference of 0.090%), Yuman ($45,446, a difference of 0.26%), and Immigrants from Honduras ($45,787, a difference of 0.48%). Similarly, the demographic groups most similar to Creek are Cuban ($46,580, a difference of 0.030%), Ottawa ($46,611, a difference of 0.040%), Dutch West Indian ($46,656, a difference of 0.13%), Immigrants from Dominican Republic ($46,655, a difference of 0.13%), and Guatemalan ($46,736, a difference of 0.30%).
| Demographics | Rating | Rank | Median Male Earnings |
| Guatemalans | 0.0 /100 | #305 | Tragic $46,736 |
| Dutch West Indians | 0.0 /100 | #306 | Tragic $46,656 |
| Immigrants | Dominican Republic | 0.0 /100 | #307 | Tragic $46,655 |
| Ottawa | 0.0 /100 | #308 | Tragic $46,611 |
| Creek | 0.0 /100 | #309 | Tragic $46,594 |
| Cubans | 0.0 /100 | #310 | Tragic $46,580 |
| Apache | 0.0 /100 | #311 | Tragic $46,429 |
| Hispanics or Latinos | 0.0 /100 | #312 | Tragic $46,419 |
| Hondurans | 0.0 /100 | #313 | Tragic $46,374 |
| Chippewa | 0.0 /100 | #314 | Tragic $46,368 |
| Immigrants | Guatemala | 0.0 /100 | #315 | Tragic $46,244 |
| Immigrants | Caribbean | 0.0 /100 | #316 | Tragic $46,193 |
| Mexicans | 0.0 /100 | #317 | Tragic $46,147 |
| Cheyenne | 0.0 /100 | #318 | Tragic $46,062 |
| Haitians | 0.0 /100 | #319 | Tragic $45,903 |
| Immigrants | Honduras | 0.0 /100 | #320 | Tragic $45,787 |
| Fijians | 0.0 /100 | #321 | Tragic $45,607 |
| Sioux | 0.0 /100 | #322 | Tragic $45,566 |
| Immigrants | Central America | 0.0 /100 | #323 | Tragic $45,538 |
| Blacks/African Americans | 0.0 /100 | #324 | Tragic $45,523 |
| Yuman | 0.0 /100 | #325 | Tragic $45,446 |