Shoshone vs Guyanese Householder Income Over 65 years

COMPARE

Shoshone
Race
Ancestry
AfghanAfricanAlaska NativeAlaskan AthabascanAlbanianAleutAlsatianAmericanApacheArabArapahoArgentineanArmenianAssyrian/Chaldean/SyriacAustralianAustrianBahamianBangladeshiBarbadianBasqueBelgianBelizeanBermudanBhutaneseBlackfeetBolivianBrazilianBritishBritish West IndianBulgarianBurmeseCajunCambodianCanadianCape VerdeanCarpatho RusynCelticCentral AmericanCentral American IndianCherokeeCheyenneChickasawChileanChineseChippewaChoctawColombianColvilleComancheCosta RicanCreeCreekCroatianCrowCubanCypriotCzechCzechoslovakianDanishDelawareDominicanDutchDutch West IndianEastern EuropeanEcuadorianEgyptianEnglishEstonianEthiopianEuropeanFijianFilipinoFinnishFrenchFrench American IndianFrench CanadianGermanGerman RussianGhanaianGreekGuamanian/ChamorroGuatemalanHaitianHmongHonduranHopiHoumaHungarianIcelanderIndian (Asian)IndonesianInupiatIranianIraqiIrishIroquoisIsraeliItalianJamaicanJapaneseJordanianKenyanKiowaKoreanLaotianLatvianLebaneseLiberianLithuanianLumbeeLuxembourgerMacedonianMalaysianMalteseMarshalleseMenomineeMexicanMexican American IndianMongolianMoroccanNative HawaiianNavajoNepaleseNew ZealanderNicaraguanNigerianNorthern EuropeanNorwegianOkinawanOsageOttawaPaiutePakistaniPalestinianPanamanianParaguayanPennsylvania GermanPeruvianPimaPolishPortuguesePotawatomiPuebloPuerto RicanPuget Sound SalishRomanianRussianSalvadoranSamoanScandinavianScotch-IrishScottishSeminoleSenegaleseSerbianShoshoneSierra LeoneanSiouxSlavicSlovakSloveneSomaliSouth AfricanSouth AmericanSouth American IndianSoviet UnionSpaniardSpanishSpanish AmericanSpanish American IndianSri LankanSubsaharan AfricanSudaneseSwedishSwissSyrianTaiwaneseThaiTlingit-HaidaTohono O'OdhamTonganTrinidadian and TobagonianTsimshianTurkishU.S. Virgin IslanderUgandanUkrainianUruguayanUteVenezuelanVietnameseWelshWest IndianYakamaYaquiYugoslavianYumanYup'ikZimbabwean
Immigration
NonimmigrantsImmigrantsAfghanistanAfricaAlbaniaArgentinaArmeniaAsiaAustraliaAustriaBahamasBangladeshBarbadosBelarusBelgiumBelizeBoliviaBosnia and HerzegovinaBrazilBulgariaBurma/MyanmarCabo VerdeCambodiaCameroonCanadaCaribbeanCentral AmericaChileChinaColombiaCongoCosta RicaCroatiaCubaCzechoslovakiaDenmarkDominicaDominican RepublicEastern AfricaEastern AsiaEastern EuropeEcuadorEgyptEl SalvadorEnglandEritreaEthiopiaEuropeFijiFranceGermanyGhanaGreeceGrenadaGuatemalaGuyanaHaitiHondurasHong KongHungaryIndiaIndonesiaIranIraqIrelandIsraelItalyJamaicaJapanJordanKazakhstanKenyaKoreaKuwaitLaosLatin AmericaLatviaLebanonLiberiaLithuaniaMalaysiaMexicoMicronesiaMiddle AfricaMoldovaMoroccoNepalNetherlandsNicaraguaNigeriaNorth AmericaNorth MacedoniaNorthern AfricaNorthern EuropeNorwayOceaniaPakistanPanamaPeruPhilippinesPolandPortugalRomaniaRussiaSaudi ArabiaScotlandSenegalSerbiaSierra LeoneSingaporeSomaliaSouth AfricaSouth AmericaSouth Central AsiaSouth Eastern AsiaSouthern EuropeSpainSri LankaSt. Vincent and the GrenadinesSudanSwedenSwitzerlandSyriaTaiwanThailandTrinidad and TobagoTurkeyUgandaUkraineUruguayUzbekistanVenezuelaVietnamWest IndiesWestern AfricaWestern AsiaWestern EuropeYemenZaireZimbabweAzores
Guyanese
Race
Ancestry
AfghanAfricanAlaska NativeAlaskan AthabascanAlbanianAleutAlsatianAmericanApacheArabArapahoArgentineanArmenianAssyrian/Chaldean/SyriacAustralianAustrianBahamianBangladeshiBarbadianBasqueBelgianBelizeanBermudanBhutaneseBlackfeetBolivianBrazilianBritishBritish West IndianBulgarianBurmeseCajunCambodianCanadianCape VerdeanCarpatho RusynCelticCentral AmericanCentral American IndianCherokeeCheyenneChickasawChileanChineseChippewaChoctawColombianColvilleComancheCosta RicanCreeCreekCroatianCrowCubanCypriotCzechCzechoslovakianDanishDelawareDominicanDutchDutch West IndianEastern EuropeanEcuadorianEgyptianEnglishEstonianEthiopianEuropeanFijianFilipinoFinnishFrenchFrench American IndianFrench CanadianGermanGerman RussianGhanaianGreekGuamanian/ChamorroGuatemalanGuyaneseHaitianHmongHonduranHopiHoumaHungarianIcelanderIndian (Asian)IndonesianInupiatIranianIraqiIrishIroquoisIsraeliItalianJamaicanJapaneseJordanianKenyanKiowaKoreanLaotianLatvianLebaneseLiberianLithuanianLumbeeLuxembourgerMacedonianMalaysianMalteseMarshalleseMenomineeMexicanMexican American IndianMongolianMoroccanNative HawaiianNavajoNepaleseNew ZealanderNicaraguanNigerianNorthern EuropeanNorwegianOkinawanOsageOttawaPaiutePakistaniPalestinianPanamanianParaguayanPennsylvania GermanPeruvianPimaPolishPortuguesePotawatomiPuebloPuerto RicanPuget Sound SalishRomanianRussianSalvadoranSamoanScandinavianScotch-IrishScottishSeminoleSenegaleseSerbianSierra LeoneanSiouxSlavicSlovakSloveneSomaliSouth AfricanSouth AmericanSouth American IndianSoviet UnionSpaniardSpanishSpanish AmericanSpanish American IndianSri LankanSubsaharan AfricanSudaneseSwedishSwissSyrianTaiwaneseThaiTlingit-HaidaTohono O'OdhamTonganTrinidadian and TobagonianTsimshianTurkishU.S. Virgin IslanderUgandanUkrainianUruguayanUteVenezuelanVietnameseWelshWest IndianYakamaYaquiYugoslavianYumanYup'ikZimbabwean
Immigration
NonimmigrantsImmigrantsAfghanistanAfricaAlbaniaArgentinaArmeniaAsiaAustraliaAustriaBahamasBangladeshBarbadosBelarusBelgiumBelizeBoliviaBosnia and HerzegovinaBrazilBulgariaBurma/MyanmarCabo VerdeCambodiaCameroonCanadaCaribbeanCentral AmericaChileChinaColombiaCongoCosta RicaCroatiaCubaCzechoslovakiaDenmarkDominicaDominican RepublicEastern AfricaEastern AsiaEastern EuropeEcuadorEgyptEl SalvadorEnglandEritreaEthiopiaEuropeFijiFranceGermanyGhanaGreeceGrenadaGuatemalaGuyanaHaitiHondurasHong KongHungaryIndiaIndonesiaIranIraqIrelandIsraelItalyJamaicaJapanJordanKazakhstanKenyaKoreaKuwaitLaosLatin AmericaLatviaLebanonLiberiaLithuaniaMalaysiaMexicoMicronesiaMiddle AfricaMoldovaMoroccoNepalNetherlandsNicaraguaNigeriaNorth AmericaNorth MacedoniaNorthern AfricaNorthern EuropeNorwayOceaniaPakistanPanamaPeruPhilippinesPolandPortugalRomaniaRussiaSaudi ArabiaScotlandSenegalSerbiaSierra LeoneSingaporeSomaliaSouth AfricaSouth AmericaSouth Central AsiaSouth Eastern AsiaSouthern EuropeSpainSri LankaSt. Vincent and the GrenadinesSudanSwedenSwitzerlandSyriaTaiwanThailandTrinidad and TobagoTurkeyUgandaUkraineUruguayUzbekistanVenezuelaVietnamWest IndiesWestern AfricaWestern AsiaWestern EuropeYemenZaireZimbabweAzores
Householder Income Over 65 years
Income
Poverty
Unemployment
Labor Participation
Family Structure
Vehicle Availability
Education Level
Disability

Householder Income Over 65 years Comparison

Shoshone

Guyanese

Tragic
Tragic
$53,681
HOUSEHOLDER INCOME OVER 65 YEARS
0.0/ 100
METRIC RATING
292nd/ 347
METRIC RANK
$56,351
HOUSEHOLDER INCOME OVER 65 YEARS
0.8/ 100
METRIC RATING
243rd/ 347
METRIC RANK

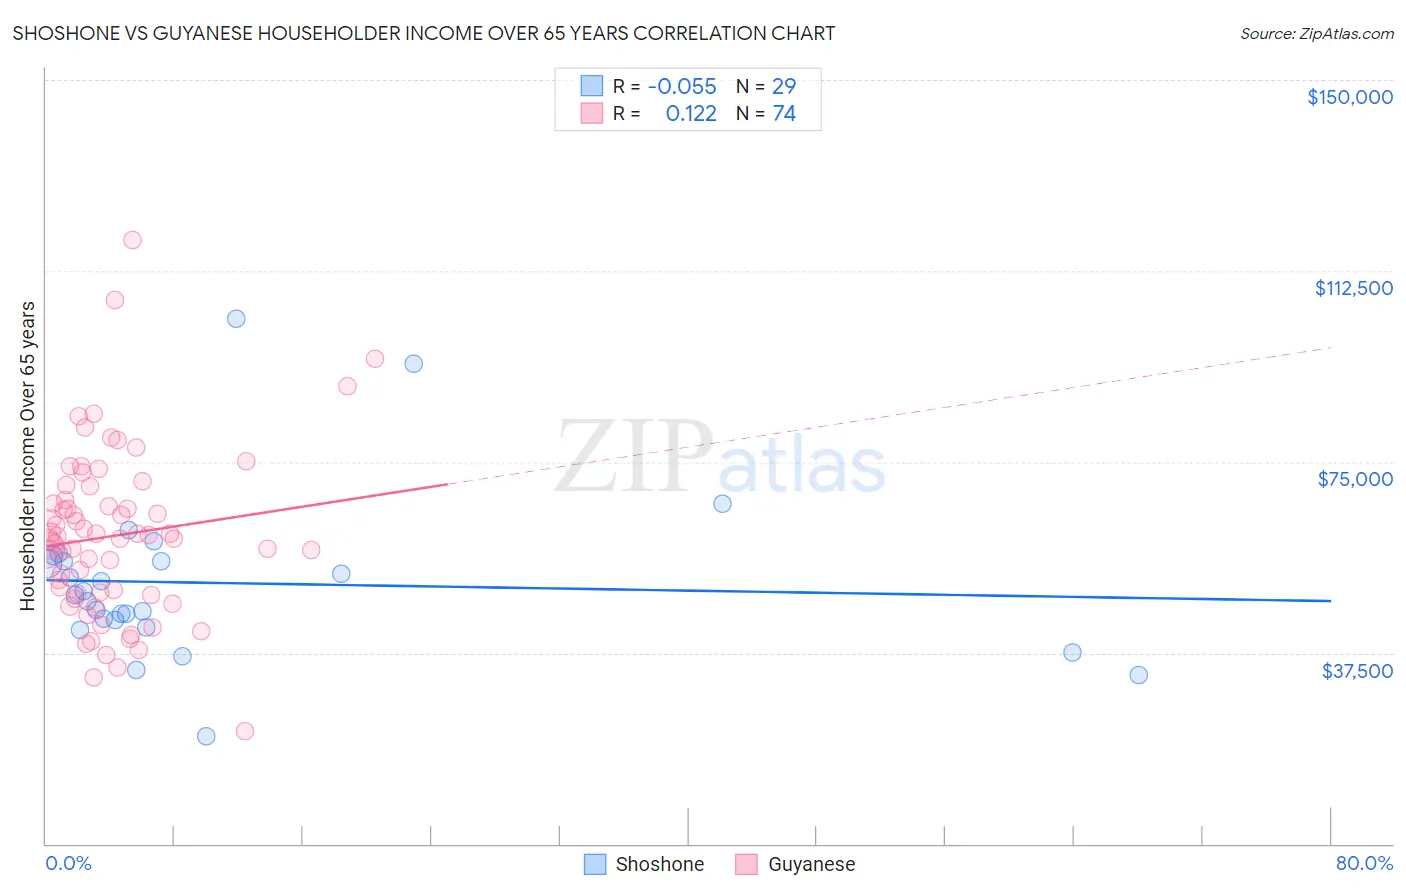
Shoshone vs Guyanese Householder Income Over 65 years Correlation Chart

The statistical analysis conducted on geographies consisting of 66,557,211 people shows a slight negative correlation between the proportion of Shoshone and household income with householder over the age of 65 in the United States with a correlation coefficient (R) of -0.055 and weighted average of $53,681. Similarly, the statistical analysis conducted on geographies consisting of 176,487,050 people shows a poor positive correlation between the proportion of Guyanese and household income with householder over the age of 65 in the United States with a correlation coefficient (R) of 0.122 and weighted average of $56,351, a difference of 5.0%.
Shoshone vs Guyanese Householder Income Over 65 years

Householder Income Over 65 years Correlation Summary

MeasurementShoshoneGuyanese
Minimum$21,000$22,090
Maximum$103,036$118,508
Range$82,036$96,418
Mean$51,211$60,484
Median$48,972$60,185
Interquartile 25% (IQ1)$43,204$49,040
Interquartile 75% (IQ3)$56,037$67,479
Interquartile Range (IQR)$12,833$18,439
Standard Deviation (Sample)$16,279$16,619
Standard Deviation (Population)$15,995$16,506

Similar Demographics by Householder Income Over 65 years

Demographics Similar to Shoshone by Householder Income Over 65 years

In terms of householder income over 65 years, the demographic groups most similar to Shoshone are Immigrants from Belize ($53,665, a difference of 0.030%), African ($53,711, a difference of 0.060%), Chickasaw ($53,732, a difference of 0.090%), Iroquois ($53,737, a difference of 0.10%), and Paiute ($53,762, a difference of 0.15%).
DemographicsRating | RankHouseholder Income Over 65 years
Mexicans
0.1
/100
|
#285
Tragic
$53,897
Chippewa
0.1
/100
|
#286
Tragic
$53,847
Immigrants | Barbados
0.1
/100
|
#287
Tragic
$53,766
Paiute
0.1
/100
|
#288
Tragic
$53,762
Iroquois
0.1
/100
|
#289
Tragic
$53,737
Chickasaw
0.1
/100
|
#290
Tragic
$53,732
Africans
0.0
/100
|
#291
Tragic
$53,711
Shoshone
0.0
/100
|
#292
Tragic
$53,681
Immigrants | Belize
0.0
/100
|
#293
Tragic
$53,665
Senegalese
0.0
/100
|
#294
Tragic
$53,591
Immigrants | Central America
0.0
/100
|
#295
Tragic
$53,420
Immigrants | Somalia
0.0
/100
|
#296
Tragic
$53,333
Immigrants | Latin America
0.0
/100
|
#297
Tragic
$53,265
Central American Indians
0.0
/100
|
#298
Tragic
$53,232
Ottawa
0.0
/100
|
#299
Tragic
$53,217

Demographics Similar to Guyanese by Householder Income Over 65 years

In terms of householder income over 65 years, the demographic groups most similar to Guyanese are Hmong ($56,339, a difference of 0.020%), Immigrants from Uzbekistan ($56,331, a difference of 0.040%), Central American ($56,321, a difference of 0.050%), Yaqui ($56,417, a difference of 0.12%), and Yakama ($56,234, a difference of 0.21%).
DemographicsRating | RankHouseholder Income Over 65 years
Immigrants | Uruguay
1.5
/100
|
#236
Tragic
$56,975
Immigrants | Panama
1.5
/100
|
#237
Tragic
$56,944
Fijians
1.2
/100
|
#238
Tragic
$56,768
Immigrants | Laos
1.2
/100
|
#239
Tragic
$56,722
Sub-Saharan Africans
1.0
/100
|
#240
Tragic
$56,615
Immigrants | Guyana
0.9
/100
|
#241
Tragic
$56,495
Yaqui
0.8
/100
|
#242
Tragic
$56,417
Guyanese
0.8
/100
|
#243
Tragic
$56,351
Hmong
0.8
/100
|
#244
Tragic
$56,339
Immigrants | Uzbekistan
0.8
/100
|
#245
Tragic
$56,331
Central Americans
0.8
/100
|
#246
Tragic
$56,321
Yakama
0.7
/100
|
#247
Tragic
$56,234
Vietnamese
0.6
/100
|
#248
Tragic
$56,143
Mexican American Indians
0.6
/100
|
#249
Tragic
$56,089
Immigrants | Bosnia and Herzegovina
0.5
/100
|
#250
Tragic
$55,986