Scottish vs Immigrants from Ghana Per Capita Income
COMPARE
Scottish
Immigrants from Ghana
Per Capita Income
Per Capita Income Comparison
Scottish
Immigrants from Ghana
$44,440
PER CAPITA INCOME
70.6/ 100
METRIC RATING
153rd/ 347
METRIC RANK
$41,131
PER CAPITA INCOME
5.5/ 100
METRIC RATING
227th/ 347
METRIC RANK
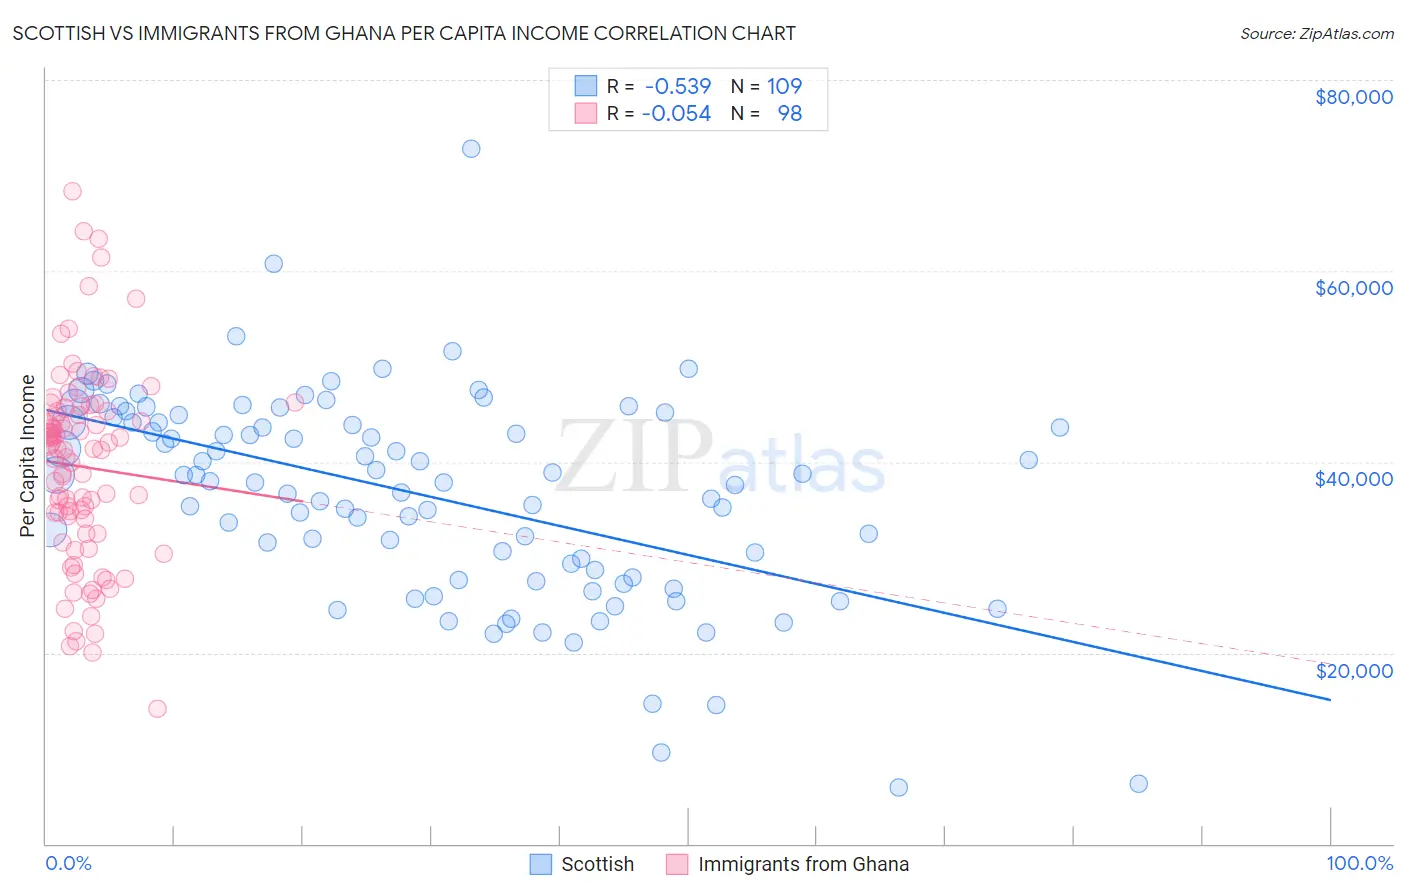
Scottish vs Immigrants from Ghana Per Capita Income Correlation Chart
The statistical analysis conducted on geographies consisting of 567,196,152 people shows a substantial negative correlation between the proportion of Scottish and per capita income in the United States with a correlation coefficient (R) of -0.539 and weighted average of $44,440. Similarly, the statistical analysis conducted on geographies consisting of 199,964,611 people shows a slight negative correlation between the proportion of Immigrants from Ghana and per capita income in the United States with a correlation coefficient (R) of -0.054 and weighted average of $41,131, a difference of 8.0%.
Per Capita Income Correlation Summary
| Measurement | Scottish | Immigrants from Ghana |
| Minimum | $5,913 | $14,179 |
| Maximum | $72,790 | $68,358 |
| Range | $66,877 | $54,179 |
| Mean | $36,544 | $39,490 |
| Median | $37,961 | $41,313 |
| Interquartile 25% (IQ1) | $28,258 | $32,441 |
| Interquartile 75% (IQ3) | $44,399 | $45,276 |
| Interquartile Range (IQR) | $16,142 | $12,835 |
| Standard Deviation (Sample) | $10,868 | $10,193 |
| Standard Deviation (Population) | $10,818 | $10,141 |
Similar Demographics by Per Capita Income
Demographics Similar to Scottish by Per Capita Income
In terms of per capita income, the demographic groups most similar to Scottish are Norwegian ($44,480, a difference of 0.090%), Peruvian ($44,479, a difference of 0.090%), Immigrants from Eritrea ($44,509, a difference of 0.16%), Portuguese ($44,362, a difference of 0.18%), and Korean ($44,522, a difference of 0.19%).
| Demographics | Rating | Rank | Per Capita Income |
| Irish | 75.8 /100 | #146 | Good $44,679 |
| Czechs | 74.1 /100 | #147 | Good $44,595 |
| Immigrants | Armenia | 73.1 /100 | #148 | Good $44,552 |
| Koreans | 72.5 /100 | #149 | Good $44,522 |
| Immigrants | Eritrea | 72.1 /100 | #150 | Good $44,509 |
| Norwegians | 71.5 /100 | #151 | Good $44,480 |
| Peruvians | 71.5 /100 | #152 | Good $44,479 |
| Scottish | 70.6 /100 | #153 | Good $44,440 |
| Portuguese | 68.7 /100 | #154 | Good $44,362 |
| Uruguayans | 67.6 /100 | #155 | Good $44,318 |
| Slovaks | 65.4 /100 | #156 | Good $44,229 |
| South American Indians | 64.8 /100 | #157 | Good $44,206 |
| Immigrants | Nepal | 64.3 /100 | #158 | Good $44,187 |
| South Americans | 62.4 /100 | #159 | Good $44,114 |
| Danes | 61.9 /100 | #160 | Good $44,095 |
Demographics Similar to Immigrants from Ghana by Per Capita Income
In terms of per capita income, the demographic groups most similar to Immigrants from Ghana are Immigrants from Grenada ($41,123, a difference of 0.020%), Immigrants from Ecuador ($41,195, a difference of 0.16%), West Indian ($41,217, a difference of 0.21%), Nigerian ($41,026, a difference of 0.26%), and Native Hawaiian ($41,017, a difference of 0.28%).
| Demographics | Rating | Rank | Per Capita Income |
| Immigrants | Barbados | 7.9 /100 | #220 | Tragic $41,478 |
| Immigrants | Trinidad and Tobago | 7.9 /100 | #221 | Tragic $41,476 |
| Immigrants | Iraq | 7.1 /100 | #222 | Tragic $41,365 |
| Immigrants | Cameroon | 6.8 /100 | #223 | Tragic $41,334 |
| Immigrants | St. Vincent and the Grenadines | 6.4 /100 | #224 | Tragic $41,270 |
| West Indians | 6.0 /100 | #225 | Tragic $41,217 |
| Immigrants | Ecuador | 5.9 /100 | #226 | Tragic $41,195 |
| Immigrants | Ghana | 5.5 /100 | #227 | Tragic $41,131 |
| Immigrants | Grenada | 5.5 /100 | #228 | Tragic $41,123 |
| Nigerians | 4.9 /100 | #229 | Tragic $41,026 |
| Native Hawaiians | 4.9 /100 | #230 | Tragic $41,017 |
| Senegalese | 4.8 /100 | #231 | Tragic $41,000 |
| Guyanese | 4.5 /100 | #232 | Tragic $40,949 |
| Delaware | 3.8 /100 | #233 | Tragic $40,778 |
| Immigrants | West Indies | 3.7 /100 | #234 | Tragic $40,763 |