Scotch-Irish vs Norwegian Householder Income Over 65 years
COMPARE
Scotch-Irish
Norwegian
Householder Income Over 65 years
Householder Income Over 65 years Comparison
Scotch-Irish
Norwegians
$59,447
HOUSEHOLDER INCOME OVER 65 YEARS
16.9/ 100
METRIC RATING
203rd/ 347
METRIC RANK
$61,104
HOUSEHOLDER INCOME OVER 65 YEARS
53.6/ 100
METRIC RATING
167th/ 347
METRIC RANK
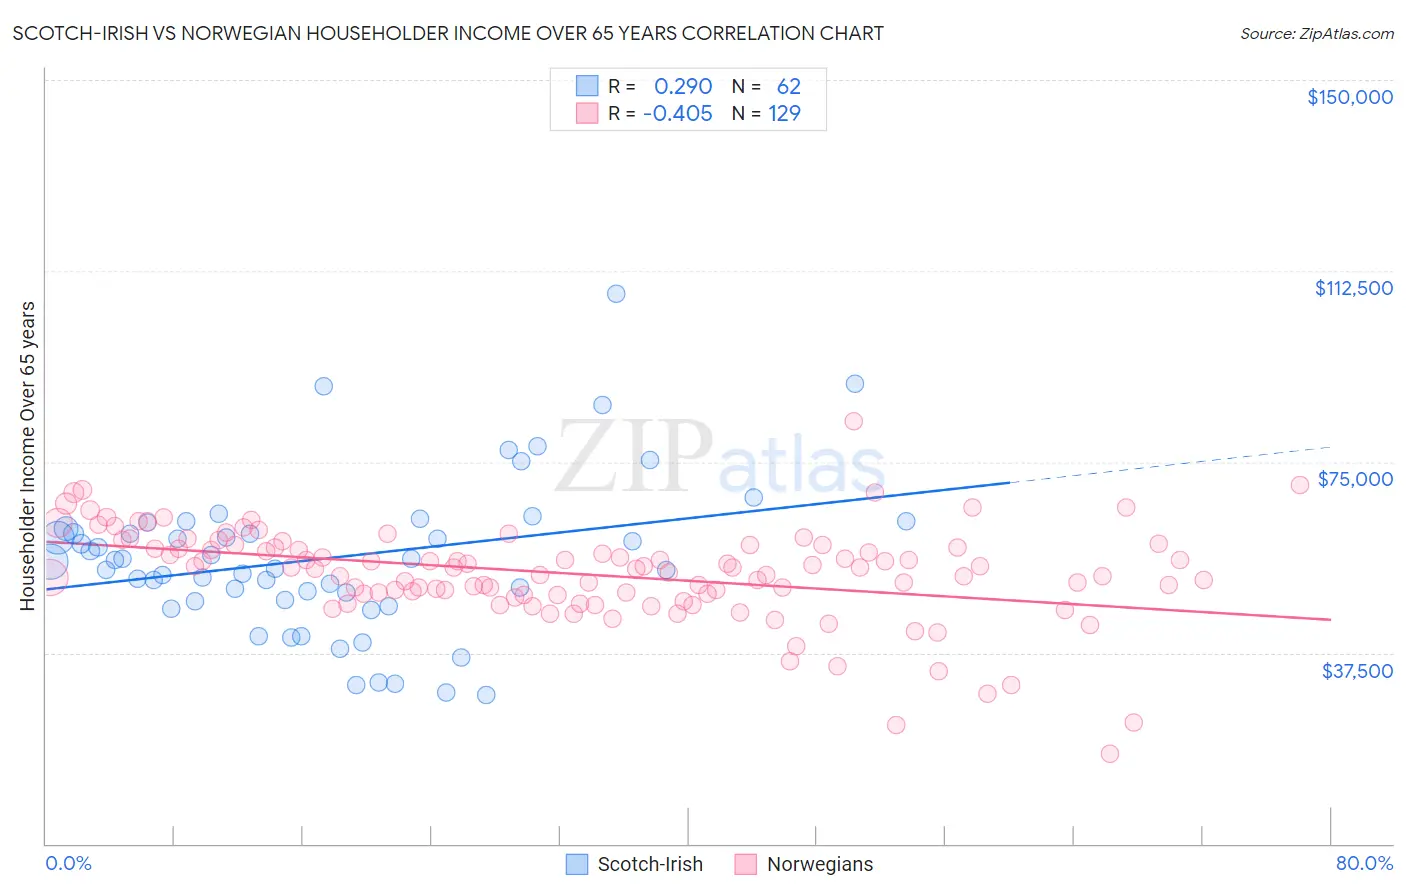
Scotch-Irish vs Norwegian Householder Income Over 65 years Correlation Chart
The statistical analysis conducted on geographies consisting of 544,677,827 people shows a weak positive correlation between the proportion of Scotch-Irish and household income with householder over the age of 65 in the United States with a correlation coefficient (R) of 0.290 and weighted average of $59,447. Similarly, the statistical analysis conducted on geographies consisting of 529,627,922 people shows a moderate negative correlation between the proportion of Norwegians and household income with householder over the age of 65 in the United States with a correlation coefficient (R) of -0.405 and weighted average of $61,104, a difference of 2.8%.
Householder Income Over 65 years Correlation Summary
| Measurement | Scotch-Irish | Norwegian |
| Minimum | $29,123 | $17,624 |
| Maximum | $108,125 | $83,083 |
| Range | $79,002 | $65,458 |
| Mean | $56,120 | $53,000 |
| Median | $55,574 | $54,270 |
| Interquartile 25% (IQ1) | $47,845 | $49,000 |
| Interquartile 75% (IQ3) | $61,936 | $58,423 |
| Interquartile Range (IQR) | $14,091 | $9,422 |
| Standard Deviation (Sample) | $15,113 | $9,391 |
| Standard Deviation (Population) | $14,991 | $9,355 |
Similar Demographics by Householder Income Over 65 years
Demographics Similar to Scotch-Irish by Householder Income Over 65 years
In terms of householder income over 65 years, the demographic groups most similar to Scotch-Irish are Arapaho ($59,383, a difference of 0.11%), Dutch ($59,539, a difference of 0.15%), Finnish ($59,535, a difference of 0.15%), Immigrants from Sudan ($59,248, a difference of 0.34%), and Immigrants ($59,656, a difference of 0.35%).
| Demographics | Rating | Rank | Householder Income Over 65 years |
| Germans | 21.5 /100 | #196 | Fair $59,730 |
| Immigrants | Kenya | 21.1 /100 | #197 | Fair $59,710 |
| Moroccans | 20.7 /100 | #198 | Fair $59,683 |
| Immigrants | Immigrants | 20.2 /100 | #199 | Fair $59,656 |
| French | 20.2 /100 | #200 | Fair $59,656 |
| Dutch | 18.3 /100 | #201 | Poor $59,539 |
| Finns | 18.2 /100 | #202 | Poor $59,535 |
| Scotch-Irish | 16.9 /100 | #203 | Poor $59,447 |
| Arapaho | 16.0 /100 | #204 | Poor $59,383 |
| Immigrants | Sudan | 14.2 /100 | #205 | Poor $59,248 |
| Immigrants | South America | 13.0 /100 | #206 | Poor $59,151 |
| Salvadorans | 12.9 /100 | #207 | Poor $59,141 |
| Uruguayans | 12.3 /100 | #208 | Poor $59,090 |
| Slovaks | 11.7 /100 | #209 | Poor $59,039 |
| Nigerians | 11.2 /100 | #210 | Poor $58,992 |
Demographics Similar to Norwegians by Householder Income Over 65 years
In terms of householder income over 65 years, the demographic groups most similar to Norwegians are Irish ($61,097, a difference of 0.010%), Carpatho Rusyn ($61,093, a difference of 0.020%), Serbian ($61,087, a difference of 0.030%), Inupiat ($61,061, a difference of 0.070%), and Immigrants from Eastern Africa ($61,157, a difference of 0.090%).
| Demographics | Rating | Rank | Householder Income Over 65 years |
| Portuguese | 62.1 /100 | #160 | Good $61,440 |
| Icelanders | 57.9 /100 | #161 | Average $61,270 |
| Czechs | 57.2 /100 | #162 | Average $61,244 |
| Ugandans | 55.5 /100 | #163 | Average $61,177 |
| Immigrants | North Macedonia | 55.4 /100 | #164 | Average $61,175 |
| Immigrants | Ukraine | 55.1 /100 | #165 | Average $61,163 |
| Immigrants | Eastern Africa | 55.0 /100 | #166 | Average $61,157 |
| Norwegians | 53.6 /100 | #167 | Average $61,104 |
| Irish | 53.4 /100 | #168 | Average $61,097 |
| Carpatho Rusyns | 53.3 /100 | #169 | Average $61,093 |
| Serbians | 53.1 /100 | #170 | Average $61,087 |
| Inupiat | 52.4 /100 | #171 | Average $61,061 |
| Immigrants | Poland | 51.9 /100 | #172 | Average $61,041 |
| Immigrants | Micronesia | 50.8 /100 | #173 | Average $61,000 |
| Luxembourgers | 50.0 /100 | #174 | Average $60,967 |