Samoan vs Immigrants from Liberia Householder Income Under 25 years
COMPARE
Samoan
Immigrants from Liberia
Householder Income Under 25 years
Householder Income Under 25 years Comparison
Samoans
Immigrants from Liberia
$54,610
HOUSEHOLDER INCOME UNDER 25 YEARS
99.7/ 100
METRIC RATING
69th/ 347
METRIC RANK
$47,981
HOUSEHOLDER INCOME UNDER 25 YEARS
0.0/ 100
METRIC RATING
302nd/ 347
METRIC RANK
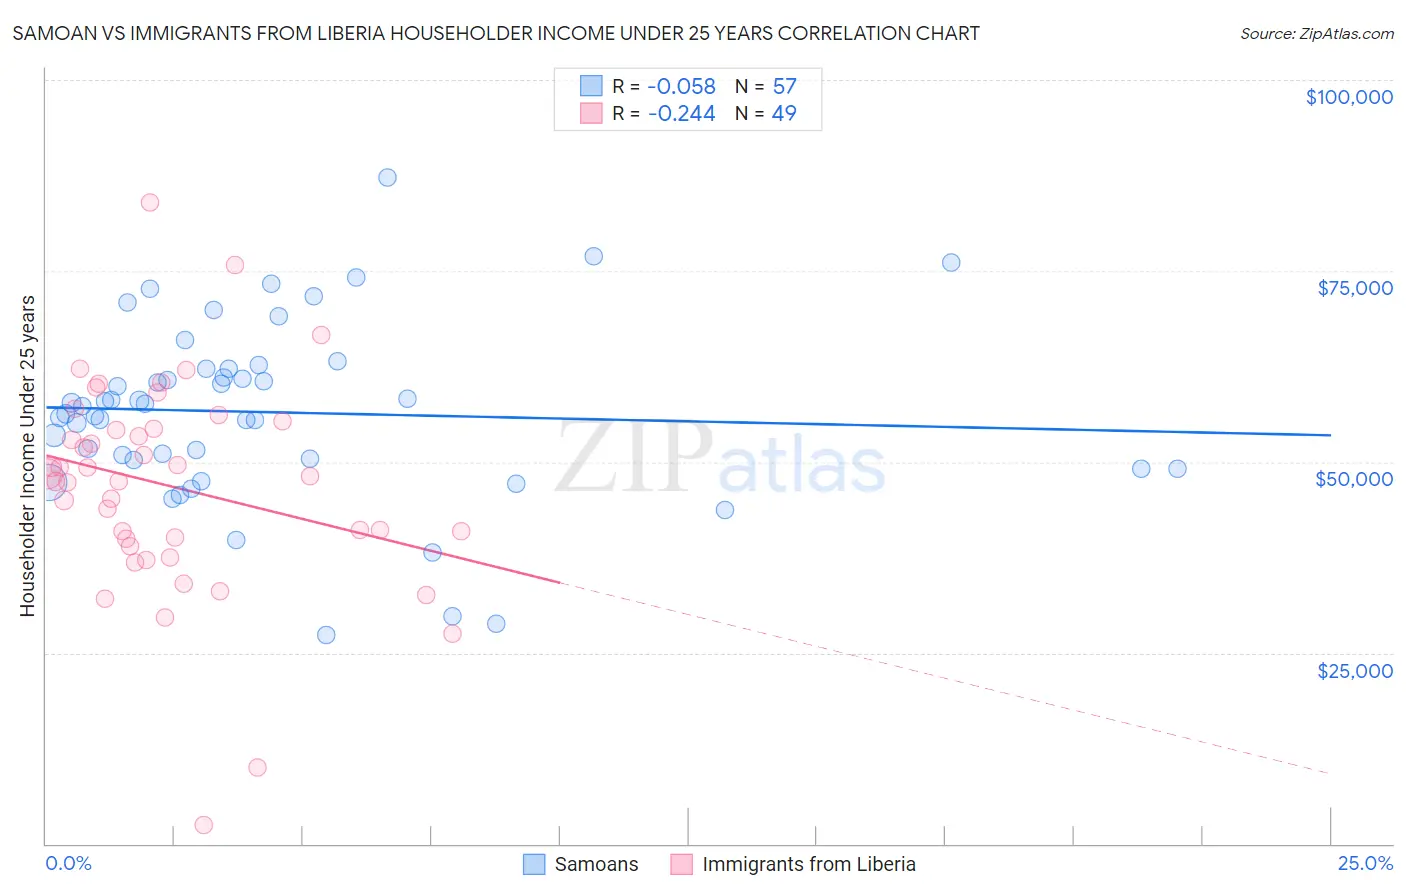
Samoan vs Immigrants from Liberia Householder Income Under 25 years Correlation Chart
The statistical analysis conducted on geographies consisting of 203,672,392 people shows a slight negative correlation between the proportion of Samoans and household income with householder under the age of 25 in the United States with a correlation coefficient (R) of -0.058 and weighted average of $54,610. Similarly, the statistical analysis conducted on geographies consisting of 125,997,994 people shows a weak negative correlation between the proportion of Immigrants from Liberia and household income with householder under the age of 25 in the United States with a correlation coefficient (R) of -0.244 and weighted average of $47,981, a difference of 13.8%.
Householder Income Under 25 years Correlation Summary
| Measurement | Samoan | Immigrants from Liberia |
| Minimum | $27,292 | $2,499 |
| Maximum | $87,292 | $83,909 |
| Range | $60,000 | $81,410 |
| Mean | $56,497 | $46,823 |
| Median | $57,308 | $48,090 |
| Interquartile 25% (IQ1) | $49,619 | $39,377 |
| Interquartile 75% (IQ3) | $62,190 | $54,819 |
| Interquartile Range (IQR) | $12,572 | $15,443 |
| Standard Deviation (Sample) | $11,785 | $14,198 |
| Standard Deviation (Population) | $11,681 | $14,053 |
Similar Demographics by Householder Income Under 25 years
Demographics Similar to Samoans by Householder Income Under 25 years
In terms of householder income under 25 years, the demographic groups most similar to Samoans are Immigrants from El Salvador ($54,599, a difference of 0.020%), Immigrants from Morocco ($54,593, a difference of 0.030%), Tsimshian ($54,649, a difference of 0.070%), Immigrants from Northern Europe ($54,571, a difference of 0.070%), and Macedonian ($54,563, a difference of 0.090%).
| Demographics | Rating | Rank | Householder Income Under 25 years |
| Immigrants | Uzbekistan | 99.8 /100 | #62 | Exceptional $54,846 |
| Immigrants | Belgium | 99.8 /100 | #63 | Exceptional $54,830 |
| Burmese | 99.8 /100 | #64 | Exceptional $54,800 |
| Yup'ik | 99.8 /100 | #65 | Exceptional $54,732 |
| Immigrants | Bangladesh | 99.8 /100 | #66 | Exceptional $54,714 |
| Okinawans | 99.8 /100 | #67 | Exceptional $54,701 |
| Tsimshian | 99.8 /100 | #68 | Exceptional $54,649 |
| Samoans | 99.7 /100 | #69 | Exceptional $54,610 |
| Immigrants | El Salvador | 99.7 /100 | #70 | Exceptional $54,599 |
| Immigrants | Morocco | 99.7 /100 | #71 | Exceptional $54,593 |
| Immigrants | Northern Europe | 99.7 /100 | #72 | Exceptional $54,571 |
| Macedonians | 99.7 /100 | #73 | Exceptional $54,563 |
| Immigrants | Grenada | 99.7 /100 | #74 | Exceptional $54,538 |
| Immigrants | Sri Lanka | 99.7 /100 | #75 | Exceptional $54,512 |
| Immigrants | Brazil | 99.6 /100 | #76 | Exceptional $54,487 |
Demographics Similar to Immigrants from Liberia by Householder Income Under 25 years
In terms of householder income under 25 years, the demographic groups most similar to Immigrants from Liberia are Immigrants from Middle Africa ($47,916, a difference of 0.14%), Menominee ($47,907, a difference of 0.15%), Cherokee ($47,848, a difference of 0.28%), Immigrants from Kuwait ($48,126, a difference of 0.30%), and Immigrants from Somalia ($48,135, a difference of 0.32%).
| Demographics | Rating | Rank | Householder Income Under 25 years |
| Central American Indians | 0.0 /100 | #295 | Tragic $48,643 |
| Blackfeet | 0.0 /100 | #296 | Tragic $48,603 |
| Cree | 0.0 /100 | #297 | Tragic $48,514 |
| Yaqui | 0.0 /100 | #298 | Tragic $48,300 |
| Immigrants | Honduras | 0.0 /100 | #299 | Tragic $48,267 |
| Immigrants | Somalia | 0.0 /100 | #300 | Tragic $48,135 |
| Immigrants | Kuwait | 0.0 /100 | #301 | Tragic $48,126 |
| Immigrants | Liberia | 0.0 /100 | #302 | Tragic $47,981 |
| Immigrants | Middle Africa | 0.0 /100 | #303 | Tragic $47,916 |
| Menominee | 0.0 /100 | #304 | Tragic $47,907 |
| Cherokee | 0.0 /100 | #305 | Tragic $47,848 |
| Natives/Alaskans | 0.0 /100 | #306 | Tragic $47,704 |
| Bangladeshis | 0.0 /100 | #307 | Tragic $47,589 |
| Comanche | 0.0 /100 | #308 | Tragic $47,518 |
| U.S. Virgin Islanders | 0.0 /100 | #309 | Tragic $47,448 |