Russian vs Menominee Wage/Income Gap
COMPARE
Russian
Menominee
Wage/Income Gap
Wage/Income Gap Comparison
Russians
Menominee
28.0%
WAGE/INCOME GAP
0.5/ 100
METRIC RATING
280th/ 347
METRIC RANK
22.7%
WAGE/INCOME GAP
99.9/ 100
METRIC RATING
67th/ 347
METRIC RANK
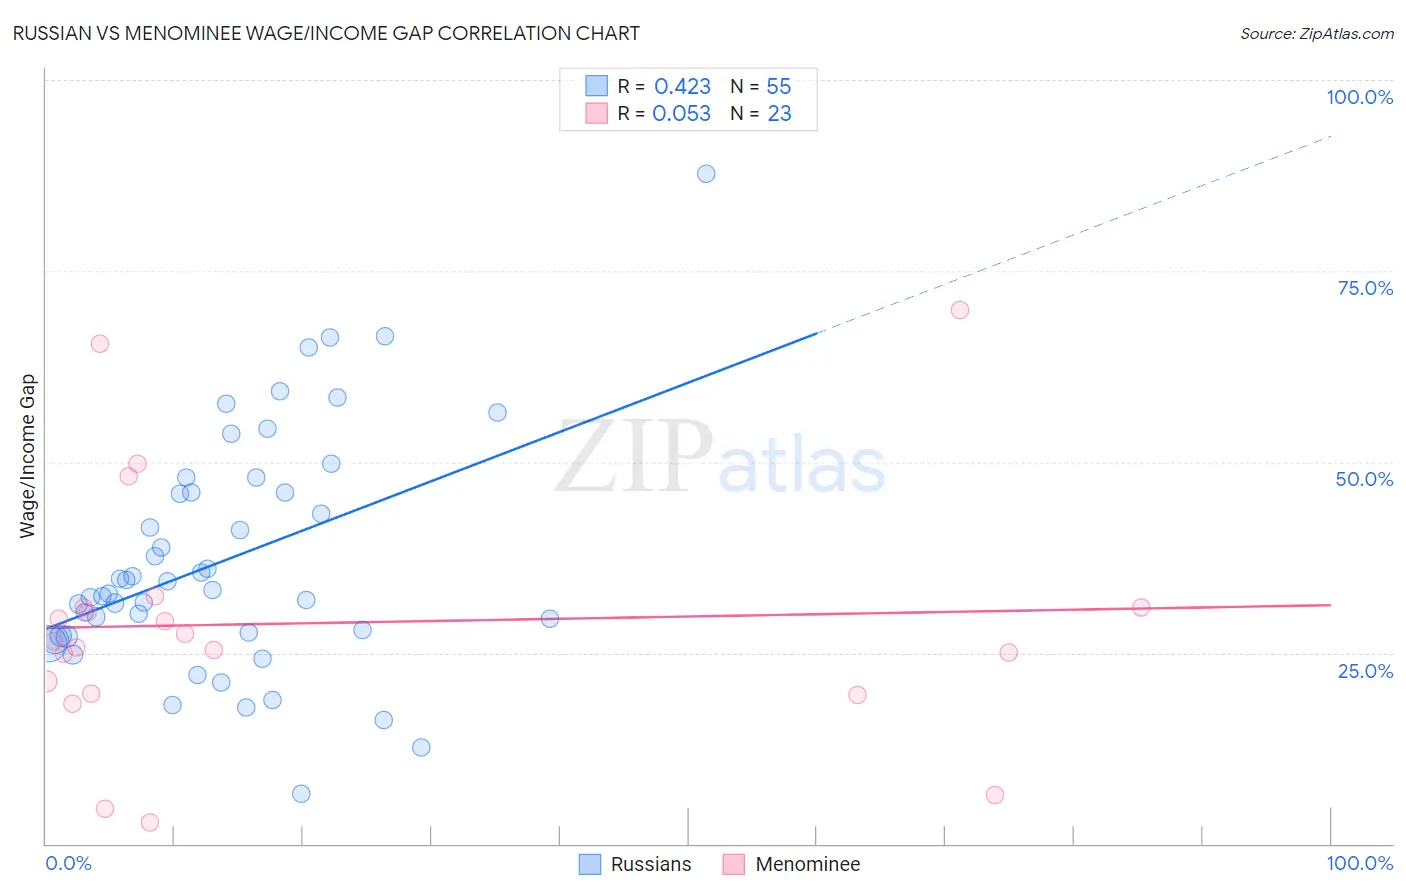
Russian vs Menominee Wage/Income Gap Correlation Chart
The statistical analysis conducted on geographies consisting of 511,171,536 people shows a moderate positive correlation between the proportion of Russians and wage/income gap percentage in the United States with a correlation coefficient (R) of 0.423 and weighted average of 28.0%. Similarly, the statistical analysis conducted on geographies consisting of 45,771,803 people shows a slight positive correlation between the proportion of Menominee and wage/income gap percentage in the United States with a correlation coefficient (R) of 0.053 and weighted average of 22.7%, a difference of 23.3%.
Wage/Income Gap Correlation Summary
| Measurement | Russian | Menominee |
| Minimum | 6.5% | 2.8% |
| Maximum | 87.7% | 70.0% |
| Range | 81.2% | 67.2% |
| Mean | 37.1% | 28.9% |
| Median | 33.2% | 26.5% |
| Interquartile 25% (IQ1) | 27.2% | 19.7% |
| Interquartile 75% (IQ3) | 46.0% | 30.9% |
| Interquartile Range (IQR) | 18.8% | 11.2% |
| Standard Deviation (Sample) | 15.5% | 16.6% |
| Standard Deviation (Population) | 15.3% | 16.2% |
Similar Demographics by Wage/Income Gap
Demographics Similar to Russians by Wage/Income Gap
In terms of wage/income gap, the demographic groups most similar to Russians are Burmese (28.0%, a difference of 0.050%), South African (28.0%, a difference of 0.080%), Romanian (28.0%, a difference of 0.15%), French Canadian (28.1%, a difference of 0.26%), and Immigrants from Sweden (28.1%, a difference of 0.26%).
| Demographics | Rating | Rank | Wage/Income Gap |
| Bulgarians | 0.7 /100 | #273 | Tragic 27.8% |
| Americans | 0.7 /100 | #274 | Tragic 27.8% |
| Immigrants | Japan | 0.7 /100 | #275 | Tragic 27.9% |
| Lebanese | 0.7 /100 | #276 | Tragic 27.9% |
| Latvians | 0.7 /100 | #277 | Tragic 27.9% |
| Immigrants | England | 0.6 /100 | #278 | Tragic 27.9% |
| Romanians | 0.5 /100 | #279 | Tragic 28.0% |
| Russians | 0.5 /100 | #280 | Tragic 28.0% |
| Burmese | 0.5 /100 | #281 | Tragic 28.0% |
| South Africans | 0.5 /100 | #282 | Tragic 28.0% |
| French Canadians | 0.4 /100 | #283 | Tragic 28.1% |
| Immigrants | Sweden | 0.4 /100 | #284 | Tragic 28.1% |
| Italians | 0.4 /100 | #285 | Tragic 28.1% |
| Immigrants | Austria | 0.4 /100 | #286 | Tragic 28.1% |
| Okinawans | 0.4 /100 | #287 | Tragic 28.1% |
Demographics Similar to Menominee by Wage/Income Gap
In terms of wage/income gap, the demographic groups most similar to Menominee are Immigrants from Nigeria (22.7%, a difference of 0.0%), Indonesian (22.7%, a difference of 0.040%), Immigrants from Uzbekistan (22.7%, a difference of 0.15%), Central American Indian (22.7%, a difference of 0.17%), and Immigrants from El Salvador (22.8%, a difference of 0.31%).
| Demographics | Rating | Rank | Wage/Income Gap |
| Immigrants | Middle Africa | 100.0 /100 | #60 | Exceptional 22.4% |
| Immigrants | Fiji | 100.0 /100 | #61 | Exceptional 22.4% |
| Immigrants | Guatemala | 100.0 /100 | #62 | Exceptional 22.5% |
| Immigrants | Ecuador | 100.0 /100 | #63 | Exceptional 22.5% |
| Spanish American Indians | 100.0 /100 | #64 | Exceptional 22.5% |
| Guatemalans | 99.9 /100 | #65 | Exceptional 22.6% |
| Central American Indians | 99.9 /100 | #66 | Exceptional 22.7% |
| Menominee | 99.9 /100 | #67 | Exceptional 22.7% |
| Immigrants | Nigeria | 99.9 /100 | #68 | Exceptional 22.7% |
| Indonesians | 99.9 /100 | #69 | Exceptional 22.7% |
| Immigrants | Uzbekistan | 99.9 /100 | #70 | Exceptional 22.7% |
| Immigrants | El Salvador | 99.9 /100 | #71 | Exceptional 22.8% |
| Sub-Saharan Africans | 99.9 /100 | #72 | Exceptional 22.8% |
| Immigrants | Eastern Africa | 99.9 /100 | #73 | Exceptional 22.8% |
| Immigrants | Burma/Myanmar | 99.9 /100 | #74 | Exceptional 22.8% |