Russian vs Marshallese Householder Income Ages 25 - 44 years
COMPARE
Russian
Marshallese
Householder Income Ages 25 - 44 years
Householder Income Ages 25 - 44 years Comparison
Russians
Marshallese
$110,398
HOUSEHOLDER INCOME AGES 25 - 44 YEARS
100.0/ 100
METRIC RATING
27th/ 347
METRIC RANK
$83,575
HOUSEHOLDER INCOME AGES 25 - 44 YEARS
0.2/ 100
METRIC RATING
274th/ 347
METRIC RANK
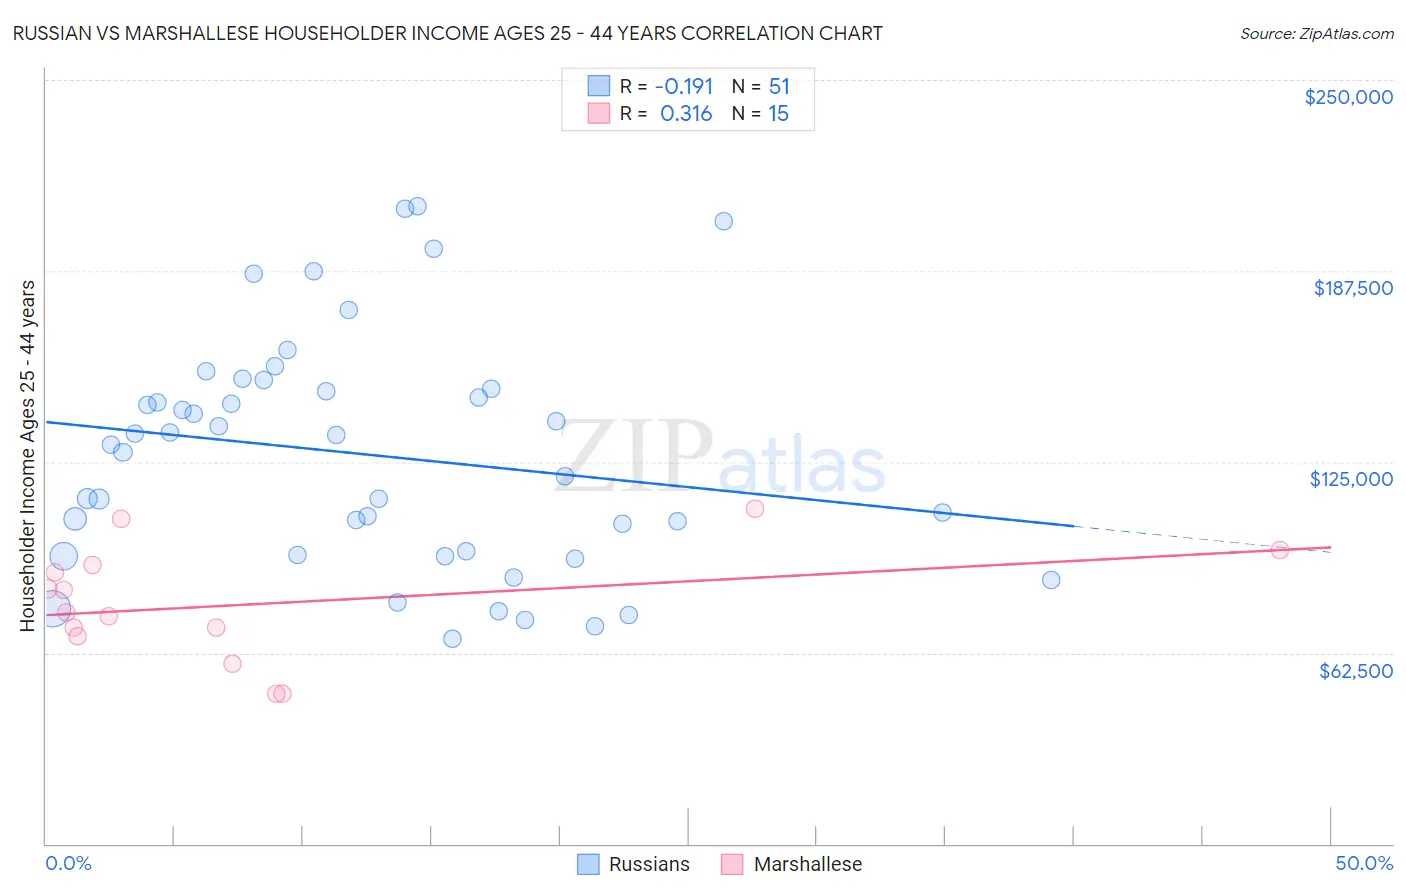
Russian vs Marshallese Householder Income Ages 25 - 44 years Correlation Chart
The statistical analysis conducted on geographies consisting of 509,334,008 people shows a poor negative correlation between the proportion of Russians and household income with householder between the ages 25 and 44 in the United States with a correlation coefficient (R) of -0.191 and weighted average of $110,398. Similarly, the statistical analysis conducted on geographies consisting of 14,753,881 people shows a mild positive correlation between the proportion of Marshallese and household income with householder between the ages 25 and 44 in the United States with a correlation coefficient (R) of 0.316 and weighted average of $83,575, a difference of 32.1%.
Householder Income Ages 25 - 44 years Correlation Summary
| Measurement | Russian | Marshallese |
| Minimum | $66,915 | $48,906 |
| Maximum | $208,545 | $109,583 |
| Range | $141,631 | $60,677 |
| Mean | $127,354 | $78,342 |
| Median | $130,564 | $75,712 |
| Interquartile 25% (IQ1) | $94,322 | $67,813 |
| Interquartile 75% (IQ3) | $149,075 | $91,124 |
| Interquartile Range (IQR) | $54,753 | $23,311 |
| Standard Deviation (Sample) | $37,897 | $18,418 |
| Standard Deviation (Population) | $37,523 | $17,794 |
Similar Demographics by Householder Income Ages 25 - 44 years
Demographics Similar to Russians by Householder Income Ages 25 - 44 years
In terms of householder income ages 25 - 44 years, the demographic groups most similar to Russians are Immigrants from Denmark ($110,363, a difference of 0.030%), Turkish ($110,318, a difference of 0.070%), Immigrants from Greece ($110,103, a difference of 0.27%), Maltese ($110,064, a difference of 0.30%), and Immigrants from Asia ($110,787, a difference of 0.35%).
| Demographics | Rating | Rank | Householder Income Ages 25 - 44 years |
| Immigrants | Korea | 100.0 /100 | #20 | Exceptional $113,401 |
| Asians | 100.0 /100 | #21 | Exceptional $112,666 |
| Immigrants | Belgium | 100.0 /100 | #22 | Exceptional $112,575 |
| Immigrants | Japan | 100.0 /100 | #23 | Exceptional $112,228 |
| Immigrants | Sweden | 100.0 /100 | #24 | Exceptional $112,010 |
| Immigrants | Northern Europe | 100.0 /100 | #25 | Exceptional $111,676 |
| Immigrants | Asia | 100.0 /100 | #26 | Exceptional $110,787 |
| Russians | 100.0 /100 | #27 | Exceptional $110,398 |
| Immigrants | Denmark | 100.0 /100 | #28 | Exceptional $110,363 |
| Turks | 100.0 /100 | #29 | Exceptional $110,318 |
| Immigrants | Greece | 100.0 /100 | #30 | Exceptional $110,103 |
| Maltese | 100.0 /100 | #31 | Exceptional $110,064 |
| Immigrants | Sri Lanka | 100.0 /100 | #32 | Exceptional $109,741 |
| Bhutanese | 100.0 /100 | #33 | Exceptional $109,520 |
| Bolivians | 100.0 /100 | #34 | Exceptional $109,372 |
Demographics Similar to Marshallese by Householder Income Ages 25 - 44 years
In terms of householder income ages 25 - 44 years, the demographic groups most similar to Marshallese are Iroquois ($83,682, a difference of 0.13%), Spanish American ($83,722, a difference of 0.18%), Somali ($83,752, a difference of 0.21%), Immigrants from Jamaica ($83,298, a difference of 0.33%), and Jamaican ($83,933, a difference of 0.43%).
| Demographics | Rating | Rank | Householder Income Ages 25 - 44 years |
| Hmong | 0.3 /100 | #267 | Tragic $84,258 |
| Sub-Saharan Africans | 0.3 /100 | #268 | Tragic $84,235 |
| Spanish American Indians | 0.3 /100 | #269 | Tragic $84,085 |
| Jamaicans | 0.3 /100 | #270 | Tragic $83,933 |
| Somalis | 0.2 /100 | #271 | Tragic $83,752 |
| Spanish Americans | 0.2 /100 | #272 | Tragic $83,722 |
| Iroquois | 0.2 /100 | #273 | Tragic $83,682 |
| Marshallese | 0.2 /100 | #274 | Tragic $83,575 |
| Immigrants | Jamaica | 0.2 /100 | #275 | Tragic $83,298 |
| Immigrants | Belize | 0.2 /100 | #276 | Tragic $83,141 |
| Paiute | 0.2 /100 | #277 | Tragic $82,984 |
| Senegalese | 0.2 /100 | #278 | Tragic $82,852 |
| Pima | 0.1 /100 | #279 | Tragic $82,821 |
| Colville | 0.1 /100 | #280 | Tragic $82,604 |
| Cajuns | 0.1 /100 | #281 | Tragic $82,393 |