Russian vs Immigrants from Jamaica Median Female Earnings
COMPARE
Russian
Immigrants from Jamaica
Median Female Earnings
Median Female Earnings Comparison
Russians
Immigrants from Jamaica
$44,169
MEDIAN FEMALE EARNINGS
100.0/ 100
METRIC RATING
34th/ 347
METRIC RANK
$38,625
MEDIAN FEMALE EARNINGS
9.7/ 100
METRIC RATING
217th/ 347
METRIC RANK
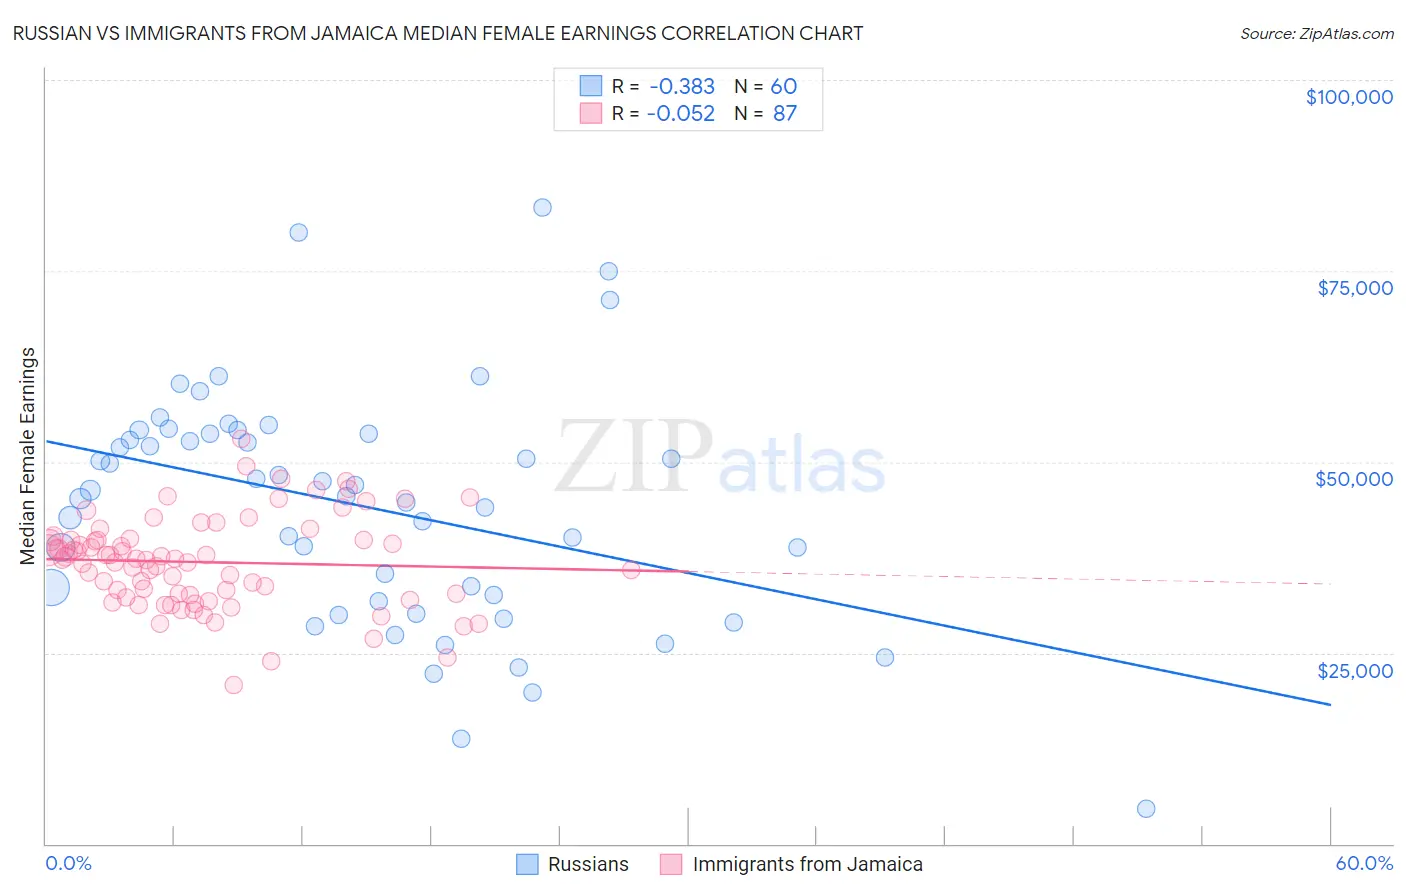
Russian vs Immigrants from Jamaica Median Female Earnings Correlation Chart
The statistical analysis conducted on geographies consisting of 511,592,990 people shows a mild negative correlation between the proportion of Russians and median female earnings in the United States with a correlation coefficient (R) of -0.383 and weighted average of $44,169. Similarly, the statistical analysis conducted on geographies consisting of 301,720,032 people shows a slight negative correlation between the proportion of Immigrants from Jamaica and median female earnings in the United States with a correlation coefficient (R) of -0.052 and weighted average of $38,625, a difference of 14.3%.
Median Female Earnings Correlation Summary
| Measurement | Russian | Immigrants from Jamaica |
| Minimum | $4,625 | $20,815 |
| Maximum | $83,305 | $53,086 |
| Range | $78,680 | $32,271 |
| Mean | $44,153 | $36,867 |
| Median | $45,890 | $37,264 |
| Interquartile 25% (IQ1) | $32,157 | $32,574 |
| Interquartile 75% (IQ3) | $53,697 | $39,745 |
| Interquartile Range (IQR) | $21,540 | $7,171 |
| Standard Deviation (Sample) | $15,453 | $5,965 |
| Standard Deviation (Population) | $15,323 | $5,931 |
Similar Demographics by Median Female Earnings
Demographics Similar to Russians by Median Female Earnings
In terms of median female earnings, the demographic groups most similar to Russians are Immigrants from Sri Lanka ($44,161, a difference of 0.020%), Immigrants from Asia ($44,198, a difference of 0.070%), Immigrants from Turkey ($44,066, a difference of 0.23%), Immigrants from Switzerland ($43,996, a difference of 0.39%), and Immigrants from Northern Europe ($44,366, a difference of 0.44%).
| Demographics | Rating | Rank | Median Female Earnings |
| Turks | 100.0 /100 | #27 | Exceptional $44,695 |
| Immigrants | Russia | 100.0 /100 | #28 | Exceptional $44,680 |
| Immigrants | Belgium | 100.0 /100 | #29 | Exceptional $44,587 |
| Asians | 100.0 /100 | #30 | Exceptional $44,586 |
| Immigrants | France | 100.0 /100 | #31 | Exceptional $44,541 |
| Immigrants | Northern Europe | 100.0 /100 | #32 | Exceptional $44,366 |
| Immigrants | Asia | 100.0 /100 | #33 | Exceptional $44,198 |
| Russians | 100.0 /100 | #34 | Exceptional $44,169 |
| Immigrants | Sri Lanka | 100.0 /100 | #35 | Exceptional $44,161 |
| Immigrants | Turkey | 100.0 /100 | #36 | Exceptional $44,066 |
| Immigrants | Switzerland | 100.0 /100 | #37 | Exceptional $43,996 |
| Latvians | 100.0 /100 | #38 | Exceptional $43,941 |
| Israelis | 100.0 /100 | #39 | Exceptional $43,852 |
| Immigrants | Malaysia | 100.0 /100 | #40 | Exceptional $43,835 |
| Bhutanese | 100.0 /100 | #41 | Exceptional $43,648 |
Demographics Similar to Immigrants from Jamaica by Median Female Earnings
In terms of median female earnings, the demographic groups most similar to Immigrants from Jamaica are Cape Verdean ($38,614, a difference of 0.030%), Immigrants from Ecuador ($38,644, a difference of 0.050%), Nepalese ($38,603, a difference of 0.060%), Spaniard ($38,656, a difference of 0.080%), and Iraqi ($38,666, a difference of 0.11%).
| Demographics | Rating | Rank | Median Female Earnings |
| Czechoslovakians | 12.0 /100 | #210 | Poor $38,738 |
| Aleuts | 11.6 /100 | #211 | Poor $38,719 |
| Guamanians/Chamorros | 11.5 /100 | #212 | Poor $38,717 |
| Jamaicans | 10.5 /100 | #213 | Poor $38,670 |
| Iraqis | 10.5 /100 | #214 | Poor $38,666 |
| Spaniards | 10.3 /100 | #215 | Poor $38,656 |
| Immigrants | Ecuador | 10.1 /100 | #216 | Poor $38,644 |
| Immigrants | Jamaica | 9.7 /100 | #217 | Tragic $38,625 |
| Cape Verdeans | 9.5 /100 | #218 | Tragic $38,614 |
| Nepalese | 9.3 /100 | #219 | Tragic $38,603 |
| Yugoslavians | 8.8 /100 | #220 | Tragic $38,573 |
| Immigrants | Azores | 8.8 /100 | #221 | Tragic $38,573 |
| Japanese | 8.1 /100 | #222 | Tragic $38,528 |
| Immigrants | Sudan | 7.8 /100 | #223 | Tragic $38,511 |
| Native Hawaiians | 7.1 /100 | #224 | Tragic $38,461 |