Russian vs Central American Indian Householder Income Under 25 years
COMPARE
Russian
Central American Indian
Householder Income Under 25 years
Householder Income Under 25 years Comparison
Russians
Central American Indians
$54,389
HOUSEHOLDER INCOME UNDER 25 YEARS
99.5/ 100
METRIC RATING
82nd/ 347
METRIC RANK
$48,643
HOUSEHOLDER INCOME UNDER 25 YEARS
0.0/ 100
METRIC RATING
295th/ 347
METRIC RANK
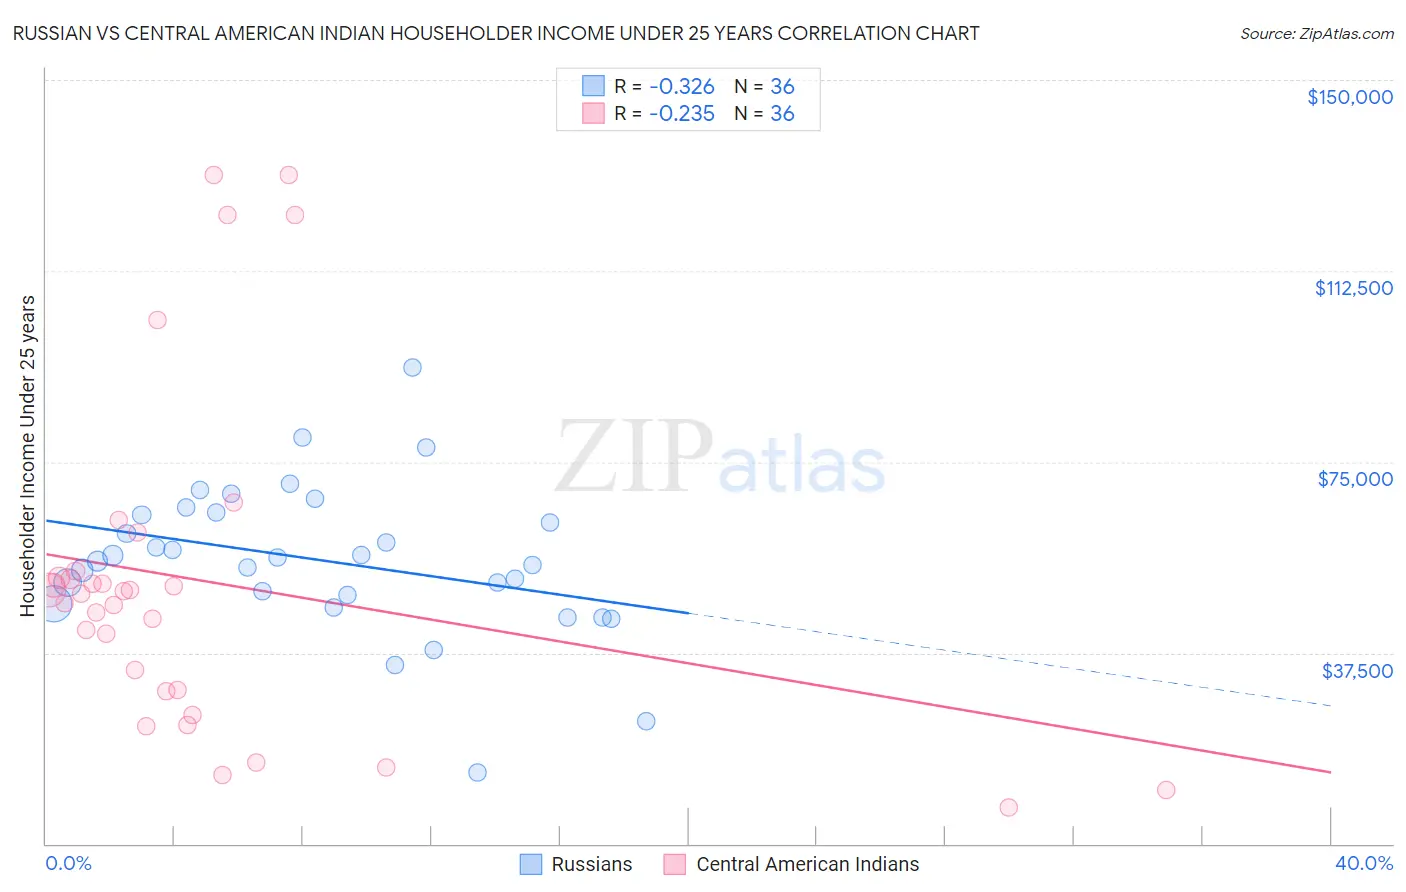
Russian vs Central American Indian Householder Income Under 25 years Correlation Chart
The statistical analysis conducted on geographies consisting of 408,933,580 people shows a mild negative correlation between the proportion of Russians and household income with householder under the age of 25 in the United States with a correlation coefficient (R) of -0.326 and weighted average of $54,389. Similarly, the statistical analysis conducted on geographies consisting of 284,650,168 people shows a weak negative correlation between the proportion of Central American Indians and household income with householder under the age of 25 in the United States with a correlation coefficient (R) of -0.235 and weighted average of $48,643, a difference of 11.8%.
Householder Income Under 25 years Correlation Summary
| Measurement | Russian | Central American Indian |
| Minimum | $13,906 | $7,000 |
| Maximum | $93,571 | $131,250 |
| Range | $79,665 | $124,250 |
| Mean | $55,615 | $51,609 |
| Median | $55,875 | $49,361 |
| Interquartile 25% (IQ1) | $48,025 | $29,986 |
| Interquartile 75% (IQ3) | $64,893 | $52,889 |
| Interquartile Range (IQR) | $16,868 | $22,903 |
| Standard Deviation (Sample) | $14,911 | $32,843 |
| Standard Deviation (Population) | $14,703 | $32,383 |
Similar Demographics by Householder Income Under 25 years
Demographics Similar to Russians by Householder Income Under 25 years
In terms of householder income under 25 years, the demographic groups most similar to Russians are Laotian ($54,369, a difference of 0.040%), Bulgarian ($54,352, a difference of 0.070%), Immigrants from Czechoslovakia ($54,352, a difference of 0.070%), Portuguese ($54,436, a difference of 0.090%), and Immigrants from Croatia ($54,343, a difference of 0.090%).
| Demographics | Rating | Rank | Householder Income Under 25 years |
| Immigrants | Sri Lanka | 99.7 /100 | #75 | Exceptional $54,512 |
| Immigrants | Brazil | 99.6 /100 | #76 | Exceptional $54,487 |
| Immigrants | Southern Europe | 99.6 /100 | #77 | Exceptional $54,484 |
| Nepalese | 99.6 /100 | #78 | Exceptional $54,472 |
| Immigrants | Italy | 99.6 /100 | #79 | Exceptional $54,449 |
| Egyptians | 99.6 /100 | #80 | Exceptional $54,444 |
| Portuguese | 99.6 /100 | #81 | Exceptional $54,436 |
| Russians | 99.5 /100 | #82 | Exceptional $54,389 |
| Laotians | 99.5 /100 | #83 | Exceptional $54,369 |
| Bulgarians | 99.5 /100 | #84 | Exceptional $54,352 |
| Immigrants | Czechoslovakia | 99.5 /100 | #85 | Exceptional $54,352 |
| Immigrants | Croatia | 99.5 /100 | #86 | Exceptional $54,343 |
| Brazilians | 99.5 /100 | #87 | Exceptional $54,335 |
| Yakama | 99.5 /100 | #88 | Exceptional $54,321 |
| Immigrants | South America | 99.4 /100 | #89 | Exceptional $54,268 |
Demographics Similar to Central American Indians by Householder Income Under 25 years
In terms of householder income under 25 years, the demographic groups most similar to Central American Indians are Somali ($48,657, a difference of 0.030%), Blackfeet ($48,603, a difference of 0.080%), Subsaharan African ($48,691, a difference of 0.10%), Shoshone ($48,720, a difference of 0.16%), and Immigrants from Burma/Myanmar ($48,749, a difference of 0.22%).
| Demographics | Rating | Rank | Householder Income Under 25 years |
| Liberians | 0.0 /100 | #288 | Tragic $48,917 |
| Hondurans | 0.0 /100 | #289 | Tragic $48,885 |
| Americans | 0.0 /100 | #290 | Tragic $48,860 |
| Immigrants | Burma/Myanmar | 0.0 /100 | #291 | Tragic $48,749 |
| Shoshone | 0.0 /100 | #292 | Tragic $48,720 |
| Sub-Saharan Africans | 0.0 /100 | #293 | Tragic $48,691 |
| Somalis | 0.0 /100 | #294 | Tragic $48,657 |
| Central American Indians | 0.0 /100 | #295 | Tragic $48,643 |
| Blackfeet | 0.0 /100 | #296 | Tragic $48,603 |
| Cree | 0.0 /100 | #297 | Tragic $48,514 |
| Yaqui | 0.0 /100 | #298 | Tragic $48,300 |
| Immigrants | Honduras | 0.0 /100 | #299 | Tragic $48,267 |
| Immigrants | Somalia | 0.0 /100 | #300 | Tragic $48,135 |
| Immigrants | Kuwait | 0.0 /100 | #301 | Tragic $48,126 |
| Immigrants | Liberia | 0.0 /100 | #302 | Tragic $47,981 |