Puget Sound Salish vs Czech Median Male Earnings
COMPARE
Puget Sound Salish
Czech
Median Male Earnings
Median Male Earnings Comparison
Puget Sound Salish
Czechs
$53,704
MEDIAN MALE EARNINGS
31.6/ 100
METRIC RATING
189th/ 347
METRIC RANK
$56,546
MEDIAN MALE EARNINGS
88.2/ 100
METRIC RATING
132nd/ 347
METRIC RANK
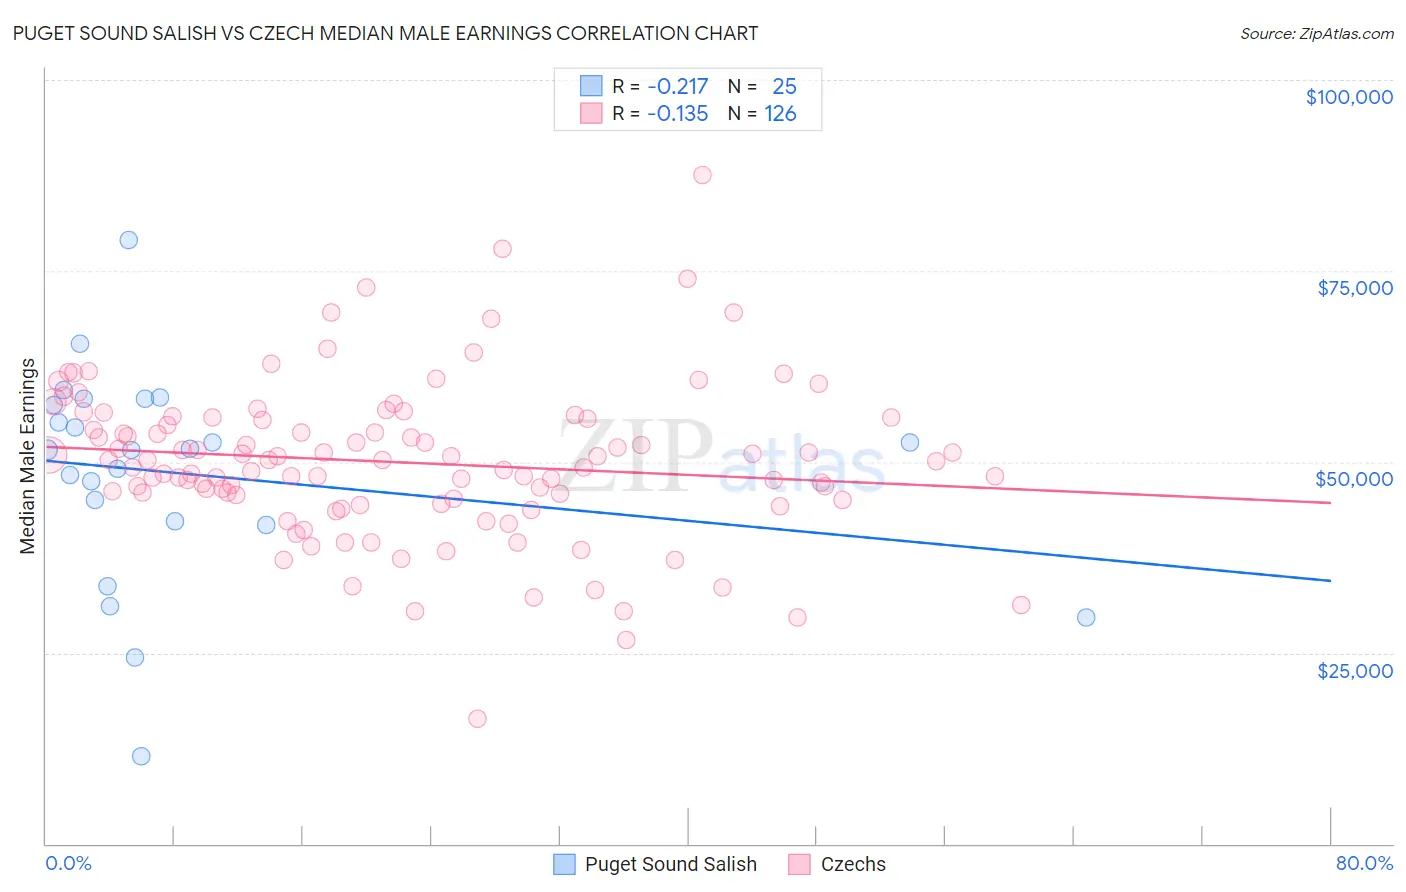
Puget Sound Salish vs Czech Median Male Earnings Correlation Chart
The statistical analysis conducted on geographies consisting of 46,150,456 people shows a weak negative correlation between the proportion of Puget Sound Salish and median male earnings in the United States with a correlation coefficient (R) of -0.217 and weighted average of $53,704. Similarly, the statistical analysis conducted on geographies consisting of 484,464,661 people shows a poor negative correlation between the proportion of Czechs and median male earnings in the United States with a correlation coefficient (R) of -0.135 and weighted average of $56,546, a difference of 5.3%.
Median Male Earnings Correlation Summary
| Measurement | Puget Sound Salish | Czech |
| Minimum | $11,507 | $16,298 |
| Maximum | $79,042 | $87,500 |
| Range | $67,535 | $71,202 |
| Mean | $48,401 | $49,947 |
| Median | $51,583 | $50,154 |
| Interquartile 25% (IQ1) | $42,007 | $45,179 |
| Interquartile 75% (IQ3) | $57,855 | $55,641 |
| Interquartile Range (IQR) | $15,848 | $10,462 |
| Standard Deviation (Sample) | $14,112 | $10,298 |
| Standard Deviation (Population) | $13,827 | $10,257 |
Similar Demographics by Median Male Earnings
Demographics Similar to Puget Sound Salish by Median Male Earnings
In terms of median male earnings, the demographic groups most similar to Puget Sound Salish are Immigrants from Eritrea ($53,715, a difference of 0.020%), Immigrants from Eastern Africa ($53,713, a difference of 0.020%), Uruguayan ($53,680, a difference of 0.040%), Guamanian/Chamorro ($53,661, a difference of 0.080%), and Scotch-Irish ($53,658, a difference of 0.090%).
| Demographics | Rating | Rank | Median Male Earnings |
| Yugoslavians | 37.4 /100 | #182 | Fair $53,967 |
| Immigrants | South America | 37.3 /100 | #183 | Fair $53,962 |
| Whites/Caucasians | 36.5 /100 | #184 | Fair $53,925 |
| Immigrants | Sierra Leone | 36.0 /100 | #185 | Fair $53,905 |
| Colombians | 34.4 /100 | #186 | Fair $53,832 |
| Immigrants | Eritrea | 31.8 /100 | #187 | Fair $53,715 |
| Immigrants | Eastern Africa | 31.8 /100 | #188 | Fair $53,713 |
| Puget Sound Salish | 31.6 /100 | #189 | Fair $53,704 |
| Uruguayans | 31.1 /100 | #190 | Fair $53,680 |
| Guamanians/Chamorros | 30.7 /100 | #191 | Fair $53,661 |
| Scotch-Irish | 30.6 /100 | #192 | Fair $53,658 |
| Kenyans | 30.4 /100 | #193 | Fair $53,647 |
| Spanish | 29.0 /100 | #194 | Fair $53,576 |
| Immigrants | Azores | 27.5 /100 | #195 | Fair $53,503 |
| Immigrants | Africa | 26.6 /100 | #196 | Fair $53,457 |
Demographics Similar to Czechs by Median Male Earnings
In terms of median male earnings, the demographic groups most similar to Czechs are Immigrants from Germany ($56,542, a difference of 0.010%), Moroccan ($56,499, a difference of 0.080%), Irish ($56,464, a difference of 0.14%), Immigrants from Saudi Arabia ($56,452, a difference of 0.17%), and Portuguese ($56,663, a difference of 0.21%).
| Demographics | Rating | Rank | Median Male Earnings |
| Immigrants | Morocco | 91.8 /100 | #125 | Exceptional $56,958 |
| Chinese | 91.1 /100 | #126 | Exceptional $56,872 |
| Brazilians | 90.9 /100 | #127 | Exceptional $56,837 |
| Immigrants | Syria | 90.8 /100 | #128 | Exceptional $56,830 |
| Pakistanis | 89.9 /100 | #129 | Excellent $56,719 |
| Koreans | 89.4 /100 | #130 | Excellent $56,672 |
| Portuguese | 89.4 /100 | #131 | Excellent $56,663 |
| Czechs | 88.2 /100 | #132 | Excellent $56,546 |
| Immigrants | Germany | 88.2 /100 | #133 | Excellent $56,542 |
| Moroccans | 87.7 /100 | #134 | Excellent $56,499 |
| Irish | 87.4 /100 | #135 | Excellent $56,464 |
| Immigrants | Saudi Arabia | 87.2 /100 | #136 | Excellent $56,452 |
| Slavs | 86.5 /100 | #137 | Excellent $56,390 |
| Slovaks | 85.5 /100 | #138 | Excellent $56,306 |
| Zimbabweans | 85.5 /100 | #139 | Excellent $56,302 |