Puerto Rican vs Slavic Median Household Income
COMPARE
Puerto Rican
Slavic
Median Household Income
Median Household Income Comparison
Puerto Ricans
Slavs
$59,197
MEDIAN HOUSEHOLD INCOME
0.0/ 100
METRIC RATING
345th/ 347
METRIC RANK
$86,398
MEDIAN HOUSEHOLD INCOME
69.7/ 100
METRIC RATING
161st/ 347
METRIC RANK
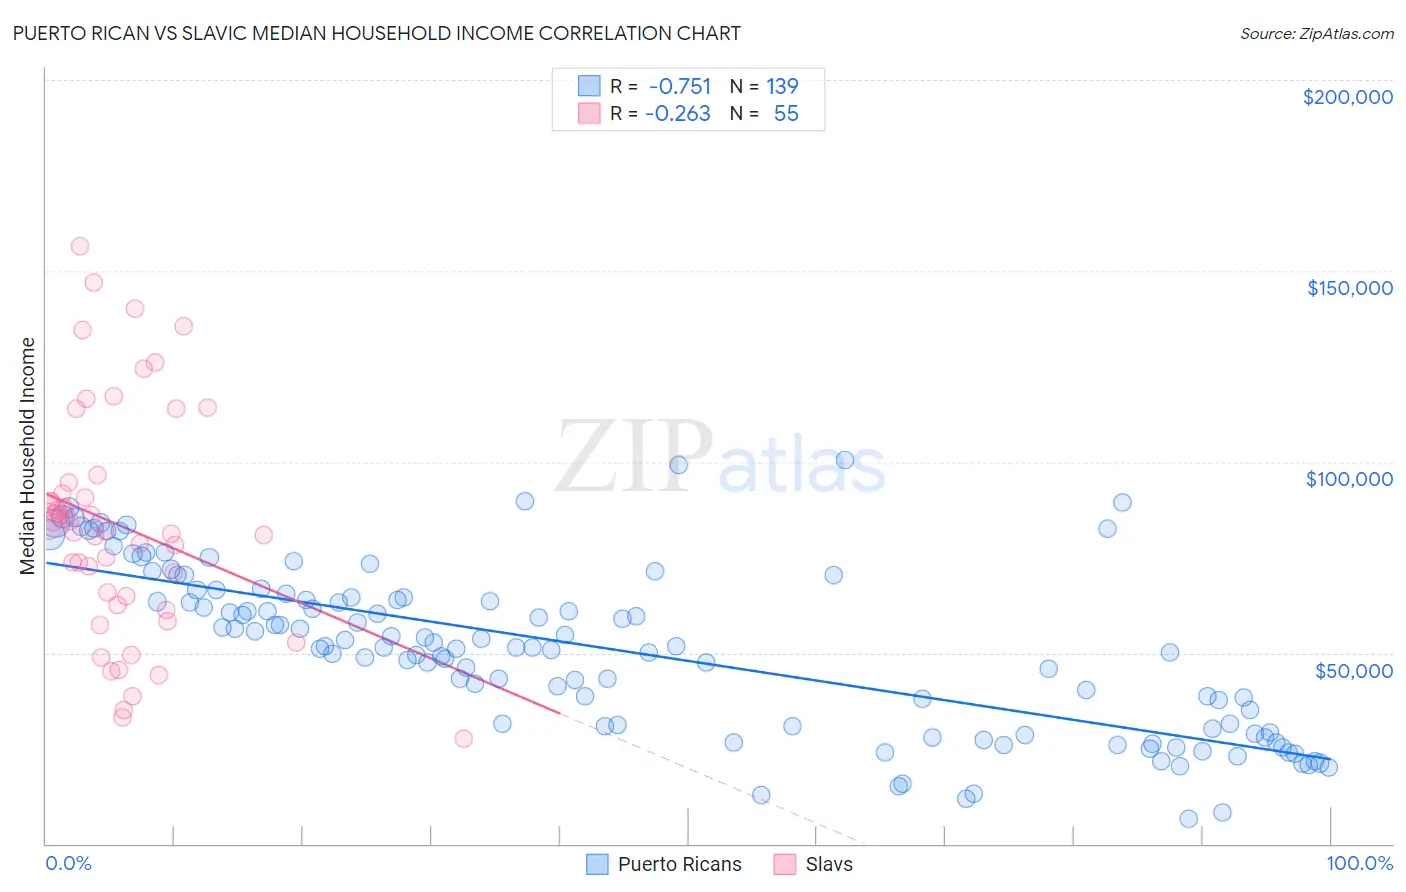
Puerto Rican vs Slavic Median Household Income Correlation Chart
The statistical analysis conducted on geographies consisting of 527,459,436 people shows a strong negative correlation between the proportion of Puerto Ricans and median household income in the United States with a correlation coefficient (R) of -0.751 and weighted average of $59,197. Similarly, the statistical analysis conducted on geographies consisting of 270,777,755 people shows a weak negative correlation between the proportion of Slavs and median household income in the United States with a correlation coefficient (R) of -0.263 and weighted average of $86,398, a difference of 46.0%.
Median Household Income Correlation Summary
| Measurement | Puerto Rican | Slavic |
| Minimum | $6,449 | $27,389 |
| Maximum | $100,425 | $156,479 |
| Range | $93,976 | $129,090 |
| Mean | $50,898 | $83,350 |
| Median | $51,527 | $81,875 |
| Interquartile 25% (IQ1) | $30,679 | $62,500 |
| Interquartile 75% (IQ3) | $65,376 | $94,752 |
| Interquartile Range (IQR) | $34,697 | $32,252 |
| Standard Deviation (Sample) | $21,767 | $29,906 |
| Standard Deviation (Population) | $21,689 | $29,633 |
Similar Demographics by Median Household Income
Demographics Similar to Puerto Ricans by Median Household Income
In terms of median household income, the demographic groups most similar to Puerto Ricans are Navajo ($59,159, a difference of 0.060%), Tohono O'odham ($61,663, a difference of 4.2%), Houma ($62,575, a difference of 5.7%), Pima ($63,262, a difference of 6.9%), and Crow ($63,681, a difference of 7.6%).
| Demographics | Rating | Rank | Median Household Income |
| Creek | 0.0 /100 | #333 | Tragic $67,715 |
| Blacks/African Americans | 0.0 /100 | #334 | Tragic $67,573 |
| Cheyenne | 0.0 /100 | #335 | Tragic $66,974 |
| Immigrants | Congo | 0.0 /100 | #336 | Tragic $66,768 |
| Kiowa | 0.0 /100 | #337 | Tragic $65,914 |
| Immigrants | Yemen | 0.0 /100 | #338 | Tragic $65,194 |
| Hopi | 0.0 /100 | #339 | Tragic $65,043 |
| Pueblo | 0.0 /100 | #340 | Tragic $64,692 |
| Crow | 0.0 /100 | #341 | Tragic $63,681 |
| Pima | 0.0 /100 | #342 | Tragic $63,262 |
| Houma | 0.0 /100 | #343 | Tragic $62,575 |
| Tohono O'odham | 0.0 /100 | #344 | Tragic $61,663 |
| Puerto Ricans | 0.0 /100 | #345 | Tragic $59,197 |
| Navajo | 0.0 /100 | #346 | Tragic $59,159 |
| Lumbee | 0.0 /100 | #347 | Tragic $54,644 |
Demographics Similar to Slavs by Median Household Income
In terms of median household income, the demographic groups most similar to Slavs are Luxembourger ($86,418, a difference of 0.020%), Immigrants from Uzbekistan ($86,425, a difference of 0.030%), Moroccan ($86,468, a difference of 0.080%), Samoan ($86,498, a difference of 0.12%), and Immigrants from Albania ($86,534, a difference of 0.16%).
| Demographics | Rating | Rank | Median Household Income |
| Immigrants | Germany | 74.4 /100 | #154 | Good $86,764 |
| Carpatho Rusyns | 72.8 /100 | #155 | Good $86,635 |
| Immigrants | Albania | 71.5 /100 | #156 | Good $86,534 |
| Samoans | 71.0 /100 | #157 | Good $86,498 |
| Moroccans | 70.6 /100 | #158 | Good $86,468 |
| Immigrants | Uzbekistan | 70.1 /100 | #159 | Good $86,425 |
| Luxembourgers | 70.0 /100 | #160 | Good $86,418 |
| Slavs | 69.7 /100 | #161 | Good $86,398 |
| Guamanians/Chamorros | 67.7 /100 | #162 | Good $86,255 |
| Czechs | 66.4 /100 | #163 | Good $86,164 |
| Irish | 66.2 /100 | #164 | Good $86,145 |
| Norwegians | 65.3 /100 | #165 | Good $86,084 |
| Scandinavians | 65.1 /100 | #166 | Good $86,073 |
| Immigrants | Immigrants | 61.3 /100 | #167 | Good $85,818 |
| Icelanders | 61.0 /100 | #168 | Good $85,797 |