Puerto Rican vs Immigrants from Latvia Median Family Income
COMPARE
Puerto Rican
Immigrants from Latvia
Median Family Income
Median Family Income Comparison
Puerto Ricans
Immigrants from Latvia
$70,423
MEDIAN FAMILY INCOME
0.0/ 100
METRIC RATING
346th/ 347
METRIC RANK
$114,826
MEDIAN FAMILY INCOME
99.8/ 100
METRIC RATING
60th/ 347
METRIC RANK
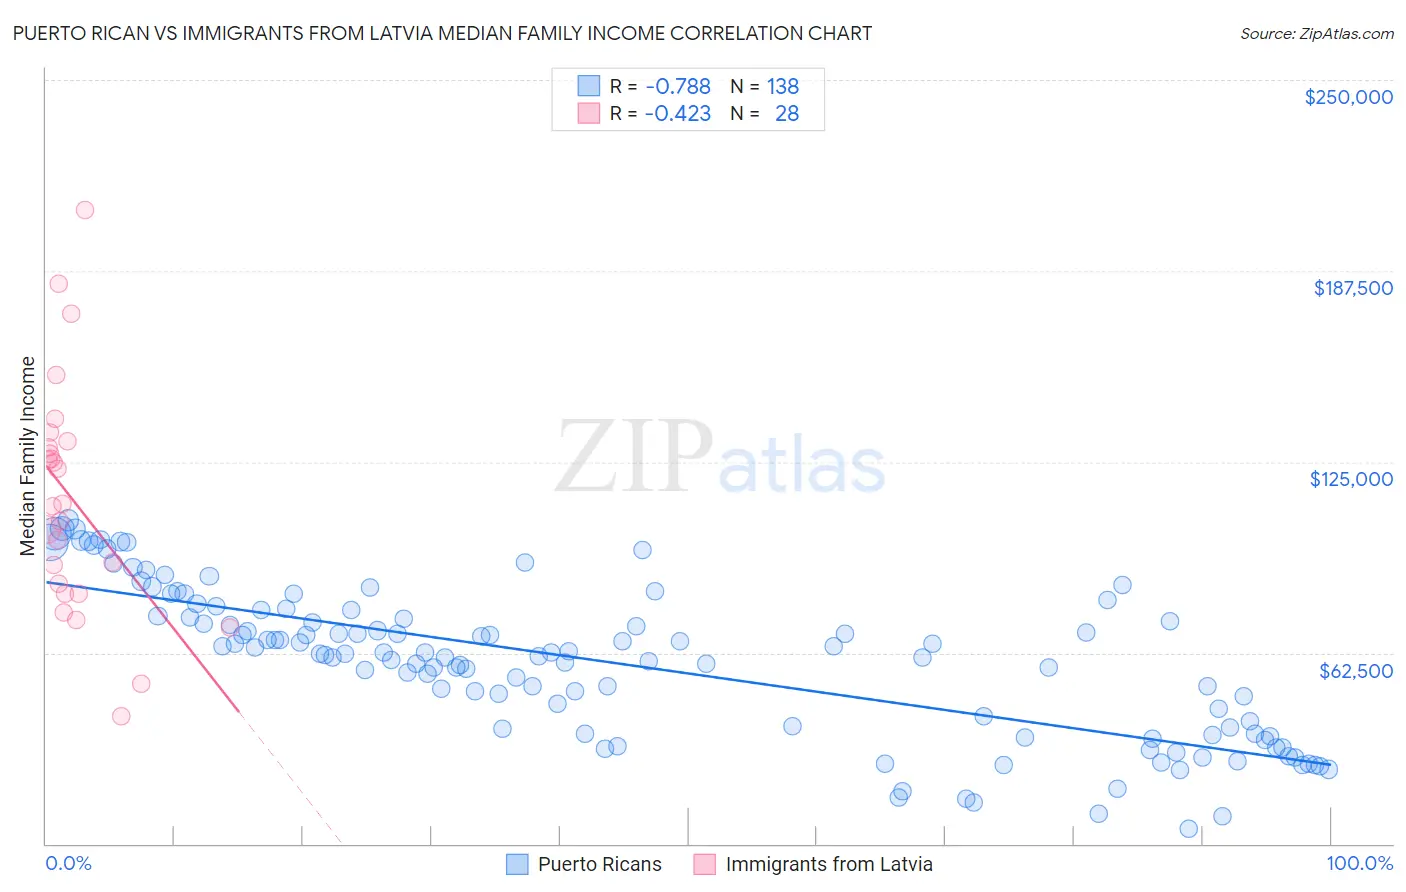
Puerto Rican vs Immigrants from Latvia Median Family Income Correlation Chart
The statistical analysis conducted on geographies consisting of 527,319,729 people shows a strong negative correlation between the proportion of Puerto Ricans and median family income in the United States with a correlation coefficient (R) of -0.788 and weighted average of $70,423. Similarly, the statistical analysis conducted on geographies consisting of 113,722,830 people shows a moderate negative correlation between the proportion of Immigrants from Latvia and median family income in the United States with a correlation coefficient (R) of -0.423 and weighted average of $114,826, a difference of 63.0%.
Median Family Income Correlation Summary
| Measurement | Puerto Rican | Immigrants from Latvia |
| Minimum | $5,070 | $41,641 |
| Maximum | $105,977 | $207,328 |
| Range | $100,907 | $165,687 |
| Mean | $59,210 | $112,663 |
| Median | $62,177 | $110,782 |
| Interquartile 25% (IQ1) | $37,461 | $83,546 |
| Interquartile 75% (IQ3) | $74,478 | $130,754 |
| Interquartile Range (IQR) | $37,017 | $47,207 |
| Standard Deviation (Sample) | $24,299 | $38,081 |
| Standard Deviation (Population) | $24,211 | $37,395 |
Similar Demographics by Median Family Income
Demographics Similar to Puerto Ricans by Median Family Income
In terms of median family income, the demographic groups most similar to Puerto Ricans are Navajo ($70,989, a difference of 0.80%), Tohono O'odham ($72,193, a difference of 2.5%), Lumbee ($68,679, a difference of 2.5%), Houma ($76,188, a difference of 8.2%), and Crow ($76,605, a difference of 8.8%).
| Demographics | Rating | Rank | Median Family Income |
| Kiowa | 0.0 /100 | #333 | Tragic $80,885 |
| Menominee | 0.0 /100 | #334 | Tragic $79,563 |
| Yup'ik | 0.0 /100 | #335 | Tragic $79,290 |
| Immigrants | Cuba | 0.0 /100 | #336 | Tragic $78,249 |
| Yuman | 0.0 /100 | #337 | Tragic $78,055 |
| Immigrants | Yemen | 0.0 /100 | #338 | Tragic $77,457 |
| Pima | 0.0 /100 | #339 | Tragic $77,431 |
| Hopi | 0.0 /100 | #340 | Tragic $77,188 |
| Pueblo | 0.0 /100 | #341 | Tragic $76,880 |
| Crow | 0.0 /100 | #342 | Tragic $76,605 |
| Houma | 0.0 /100 | #343 | Tragic $76,188 |
| Tohono O'odham | 0.0 /100 | #344 | Tragic $72,193 |
| Navajo | 0.0 /100 | #345 | Tragic $70,989 |
| Puerto Ricans | 0.0 /100 | #346 | Tragic $70,423 |
| Lumbee | 0.0 /100 | #347 | Tragic $68,679 |
Demographics Similar to Immigrants from Latvia by Median Family Income
In terms of median family income, the demographic groups most similar to Immigrants from Latvia are Immigrants from Netherlands ($114,987, a difference of 0.14%), Immigrants from Belarus ($114,586, a difference of 0.21%), Mongolian ($114,553, a difference of 0.24%), Immigrants from Indonesia ($115,162, a difference of 0.29%), and Greek ($115,192, a difference of 0.32%).
| Demographics | Rating | Rank | Median Family Income |
| Immigrants | Norway | 99.9 /100 | #53 | Exceptional $115,847 |
| Immigrants | Europe | 99.9 /100 | #54 | Exceptional $115,523 |
| Lithuanians | 99.8 /100 | #55 | Exceptional $115,395 |
| New Zealanders | 99.8 /100 | #56 | Exceptional $115,230 |
| Greeks | 99.8 /100 | #57 | Exceptional $115,192 |
| Immigrants | Indonesia | 99.8 /100 | #58 | Exceptional $115,162 |
| Immigrants | Netherlands | 99.8 /100 | #59 | Exceptional $114,987 |
| Immigrants | Latvia | 99.8 /100 | #60 | Exceptional $114,826 |
| Immigrants | Belarus | 99.8 /100 | #61 | Exceptional $114,586 |
| Mongolians | 99.8 /100 | #62 | Exceptional $114,553 |
| Immigrants | Pakistan | 99.8 /100 | #63 | Exceptional $114,406 |
| Immigrants | Scotland | 99.7 /100 | #64 | Exceptional $114,392 |
| Egyptians | 99.7 /100 | #65 | Exceptional $114,119 |
| Paraguayans | 99.7 /100 | #66 | Exceptional $114,016 |
| Immigrants | Spain | 99.7 /100 | #67 | Exceptional $113,815 |