Puerto Rican vs Houma Householder Income Ages 25 - 44 years
COMPARE
Puerto Rican
Houma
Householder Income Ages 25 - 44 years
Householder Income Ages 25 - 44 years Comparison
Puerto Ricans
Houma
$65,996
HOUSEHOLDER INCOME AGES 25 - 44 YEARS
0.0/ 100
METRIC RATING
346th/ 347
METRIC RANK
$77,044
HOUSEHOLDER INCOME AGES 25 - 44 YEARS
0.0/ 100
METRIC RATING
326th/ 347
METRIC RANK
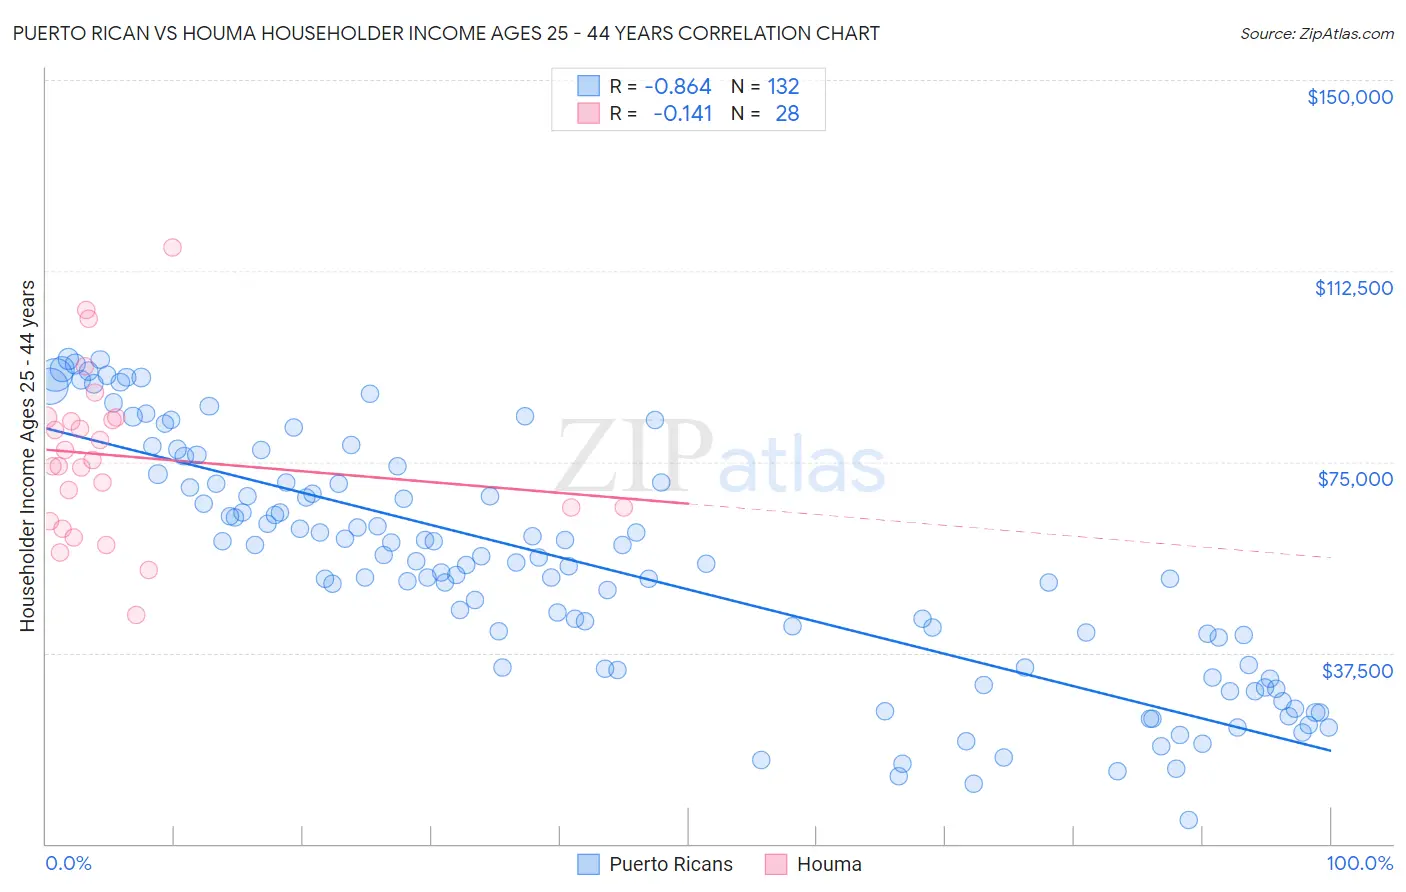
Puerto Rican vs Houma Householder Income Ages 25 - 44 years Correlation Chart
The statistical analysis conducted on geographies consisting of 525,288,469 people shows a very strong negative correlation between the proportion of Puerto Ricans and household income with householder between the ages 25 and 44 in the United States with a correlation coefficient (R) of -0.864 and weighted average of $65,996. Similarly, the statistical analysis conducted on geographies consisting of 36,744,797 people shows a poor negative correlation between the proportion of Houma and household income with householder between the ages 25 and 44 in the United States with a correlation coefficient (R) of -0.141 and weighted average of $77,044, a difference of 16.7%.
Householder Income Ages 25 - 44 years Correlation Summary
| Measurement | Puerto Rican | Houma |
| Minimum | $4,659 | $44,839 |
| Maximum | $95,273 | $117,083 |
| Range | $90,614 | $72,244 |
| Mean | $54,540 | $76,117 |
| Median | $55,330 | $74,711 |
| Interquartile 25% (IQ1) | $34,463 | $64,767 |
| Interquartile 75% (IQ3) | $70,867 | $83,511 |
| Interquartile Range (IQR) | $36,404 | $18,745 |
| Standard Deviation (Sample) | $23,369 | $16,133 |
| Standard Deviation (Population) | $23,280 | $15,843 |
Demographics Similar to Puerto Ricans and Houma by Householder Income Ages 25 - 44 years
In terms of householder income ages 25 - 44 years, the demographic groups most similar to Puerto Ricans are Navajo ($66,529, a difference of 0.81%), Pueblo ($68,910, a difference of 4.4%), Tohono O'odham ($69,068, a difference of 4.6%), Crow ($71,337, a difference of 8.1%), and Arapaho ($71,697, a difference of 8.6%). Similarly, the demographic groups most similar to Houma are Immigrants from Bahamas ($76,910, a difference of 0.17%), Immigrants from Cuba ($76,701, a difference of 0.45%), Seminole ($76,584, a difference of 0.60%), Yakama ($76,226, a difference of 1.1%), and Native/Alaskan ($75,647, a difference of 1.8%).
| Demographics | Rating | Rank | Householder Income Ages 25 - 44 years |
| Houma | 0.0 /100 | #326 | Tragic $77,044 |
| Immigrants | Bahamas | 0.0 /100 | #327 | Tragic $76,910 |
| Immigrants | Cuba | 0.0 /100 | #328 | Tragic $76,701 |
| Seminole | 0.0 /100 | #329 | Tragic $76,584 |
| Yakama | 0.0 /100 | #330 | Tragic $76,226 |
| Natives/Alaskans | 0.0 /100 | #331 | Tragic $75,647 |
| Bahamians | 0.0 /100 | #332 | Tragic $75,395 |
| Hopi | 0.0 /100 | #333 | Tragic $75,002 |
| Creek | 0.0 /100 | #334 | Tragic $74,847 |
| Kiowa | 0.0 /100 | #335 | Tragic $74,776 |
| Yup'ik | 0.0 /100 | #336 | Tragic $73,688 |
| Blacks/African Americans | 0.0 /100 | #337 | Tragic $73,370 |
| Immigrants | Yemen | 0.0 /100 | #338 | Tragic $73,043 |
| Yuman | 0.0 /100 | #339 | Tragic $72,956 |
| Immigrants | Congo | 0.0 /100 | #340 | Tragic $72,178 |
| Arapaho | 0.0 /100 | #341 | Tragic $71,697 |
| Crow | 0.0 /100 | #342 | Tragic $71,337 |
| Tohono O'odham | 0.0 /100 | #343 | Tragic $69,068 |
| Pueblo | 0.0 /100 | #344 | Tragic $68,910 |
| Navajo | 0.0 /100 | #345 | Tragic $66,529 |
| Puerto Ricans | 0.0 /100 | #346 | Tragic $65,996 |