Pueblo vs Immigrants from Thailand Median Earnings
COMPARE
Pueblo
Immigrants from Thailand
Median Earnings
Median Earnings Comparison
Pueblo
Immigrants from Thailand
$36,859
MEDIAN EARNINGS
0.0/ 100
METRIC RATING
343rd/ 347
METRIC RANK
$45,598
MEDIAN EARNINGS
23.7/ 100
METRIC RATING
209th/ 347
METRIC RANK
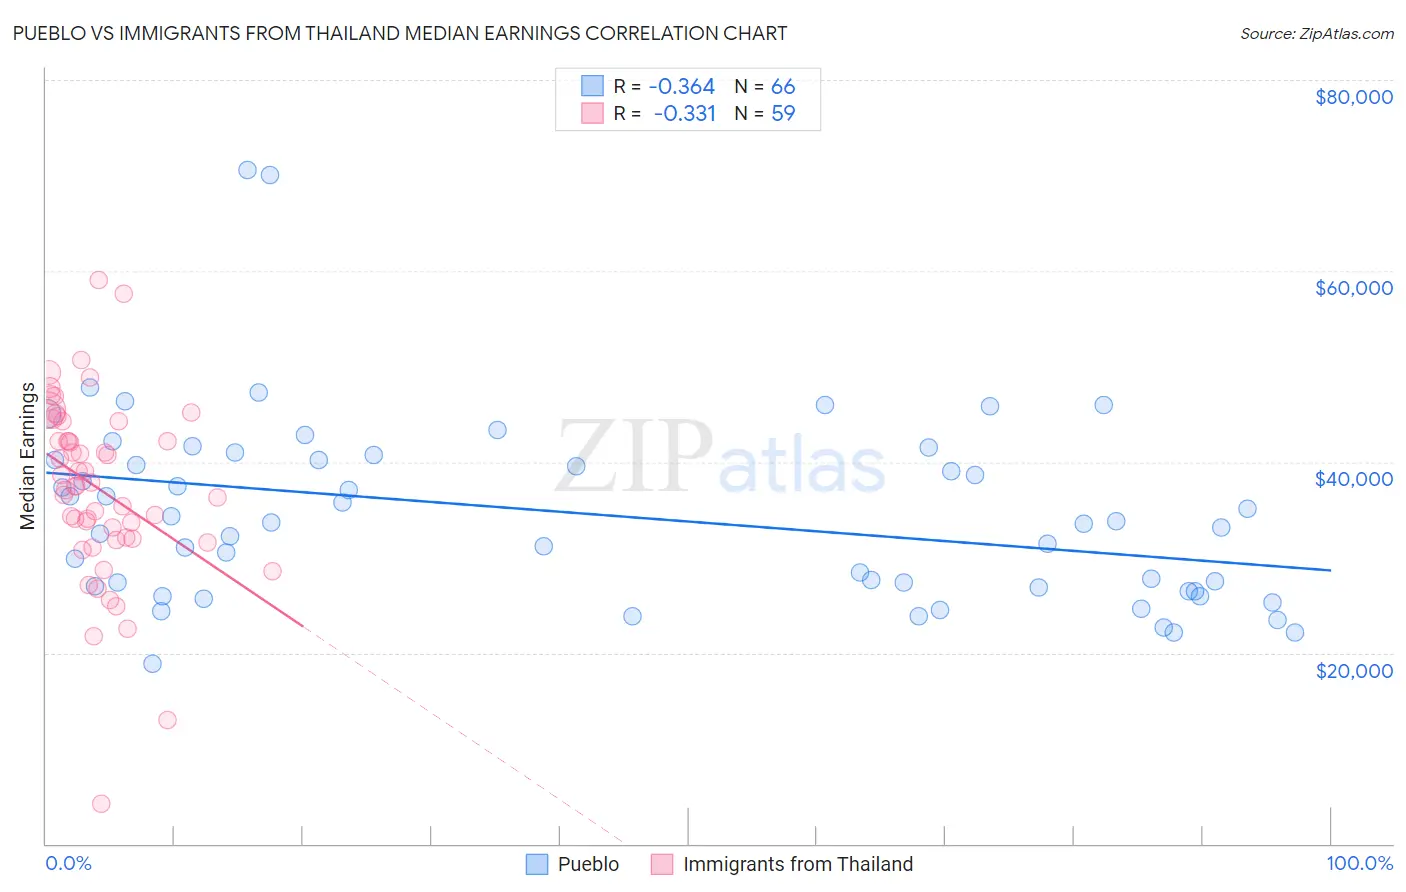
Pueblo vs Immigrants from Thailand Median Earnings Correlation Chart
The statistical analysis conducted on geographies consisting of 120,073,661 people shows a mild negative correlation between the proportion of Pueblo and median earnings in the United States with a correlation coefficient (R) of -0.364 and weighted average of $36,859. Similarly, the statistical analysis conducted on geographies consisting of 316,998,923 people shows a mild negative correlation between the proportion of Immigrants from Thailand and median earnings in the United States with a correlation coefficient (R) of -0.331 and weighted average of $45,598, a difference of 23.7%.
Median Earnings Correlation Summary
| Measurement | Pueblo | Immigrants from Thailand |
| Minimum | $18,846 | $4,250 |
| Maximum | $70,625 | $59,094 |
| Range | $51,779 | $54,844 |
| Mean | $34,570 | $37,184 |
| Median | $33,598 | $37,501 |
| Interquartile 25% (IQ1) | $26,791 | $31,980 |
| Interquartile 75% (IQ3) | $40,227 | $44,250 |
| Interquartile Range (IQR) | $13,436 | $12,270 |
| Standard Deviation (Sample) | $9,914 | $9,579 |
| Standard Deviation (Population) | $9,839 | $9,498 |
Similar Demographics by Median Earnings
Demographics Similar to Pueblo by Median Earnings
In terms of median earnings, the demographic groups most similar to Pueblo are Hopi ($36,871, a difference of 0.030%), Lumbee ($36,876, a difference of 0.050%), Navajo ($36,999, a difference of 0.38%), Arapaho ($36,586, a difference of 0.75%), and Tohono O'odham ($36,349, a difference of 1.4%).
| Demographics | Rating | Rank | Median Earnings |
| Houma | 0.0 /100 | #333 | Tragic $38,949 |
| Spanish American Indians | 0.0 /100 | #334 | Tragic $38,907 |
| Natives/Alaskans | 0.0 /100 | #335 | Tragic $38,896 |
| Crow | 0.0 /100 | #336 | Tragic $38,707 |
| Immigrants | Cuba | 0.0 /100 | #337 | Tragic $38,426 |
| Pima | 0.0 /100 | #338 | Tragic $38,285 |
| Menominee | 0.0 /100 | #339 | Tragic $37,884 |
| Navajo | 0.0 /100 | #340 | Tragic $36,999 |
| Lumbee | 0.0 /100 | #341 | Tragic $36,876 |
| Hopi | 0.0 /100 | #342 | Tragic $36,871 |
| Pueblo | 0.0 /100 | #343 | Tragic $36,859 |
| Arapaho | 0.0 /100 | #344 | Tragic $36,586 |
| Tohono O'odham | 0.0 /100 | #345 | Tragic $36,349 |
| Yup'ik | 0.0 /100 | #346 | Tragic $35,942 |
| Puerto Ricans | 0.0 /100 | #347 | Tragic $35,560 |
Demographics Similar to Immigrants from Thailand by Median Earnings
In terms of median earnings, the demographic groups most similar to Immigrants from Thailand are Immigrants from Bosnia and Herzegovina ($45,600, a difference of 0.0%), Immigrants from Grenada ($45,596, a difference of 0.0%), Panamanian ($45,593, a difference of 0.010%), Bermudan ($45,593, a difference of 0.010%), and Immigrants from Senegal ($45,611, a difference of 0.030%).
| Demographics | Rating | Rank | Median Earnings |
| Immigrants | Trinidad and Tobago | 27.1 /100 | #202 | Fair $45,729 |
| Welsh | 26.6 /100 | #203 | Fair $45,710 |
| Immigrants | Uruguay | 25.9 /100 | #204 | Fair $45,682 |
| Tongans | 25.4 /100 | #205 | Fair $45,665 |
| Immigrants | Ghana | 24.8 /100 | #206 | Fair $45,641 |
| Immigrants | Senegal | 24.0 /100 | #207 | Fair $45,611 |
| Immigrants | Bosnia and Herzegovina | 23.7 /100 | #208 | Fair $45,600 |
| Immigrants | Thailand | 23.7 /100 | #209 | Fair $45,598 |
| Immigrants | Grenada | 23.6 /100 | #210 | Fair $45,596 |
| Panamanians | 23.5 /100 | #211 | Fair $45,593 |
| Bermudans | 23.5 /100 | #212 | Fair $45,593 |
| Immigrants | Colombia | 22.4 /100 | #213 | Fair $45,550 |
| Nigerians | 22.0 /100 | #214 | Fair $45,532 |
| Immigrants | Bangladesh | 22.0 /100 | #215 | Fair $45,532 |
| Guyanese | 20.6 /100 | #216 | Fair $45,470 |