Pueblo vs Immigrants from Poland Median Family Income
COMPARE
Pueblo
Immigrants from Poland
Median Family Income
Median Family Income Comparison
Pueblo
Immigrants from Poland
$76,880
MEDIAN FAMILY INCOME
0.0/ 100
METRIC RATING
341st/ 347
METRIC RANK
$108,570
MEDIAN FAMILY INCOME
95.3/ 100
METRIC RATING
112th/ 347
METRIC RANK
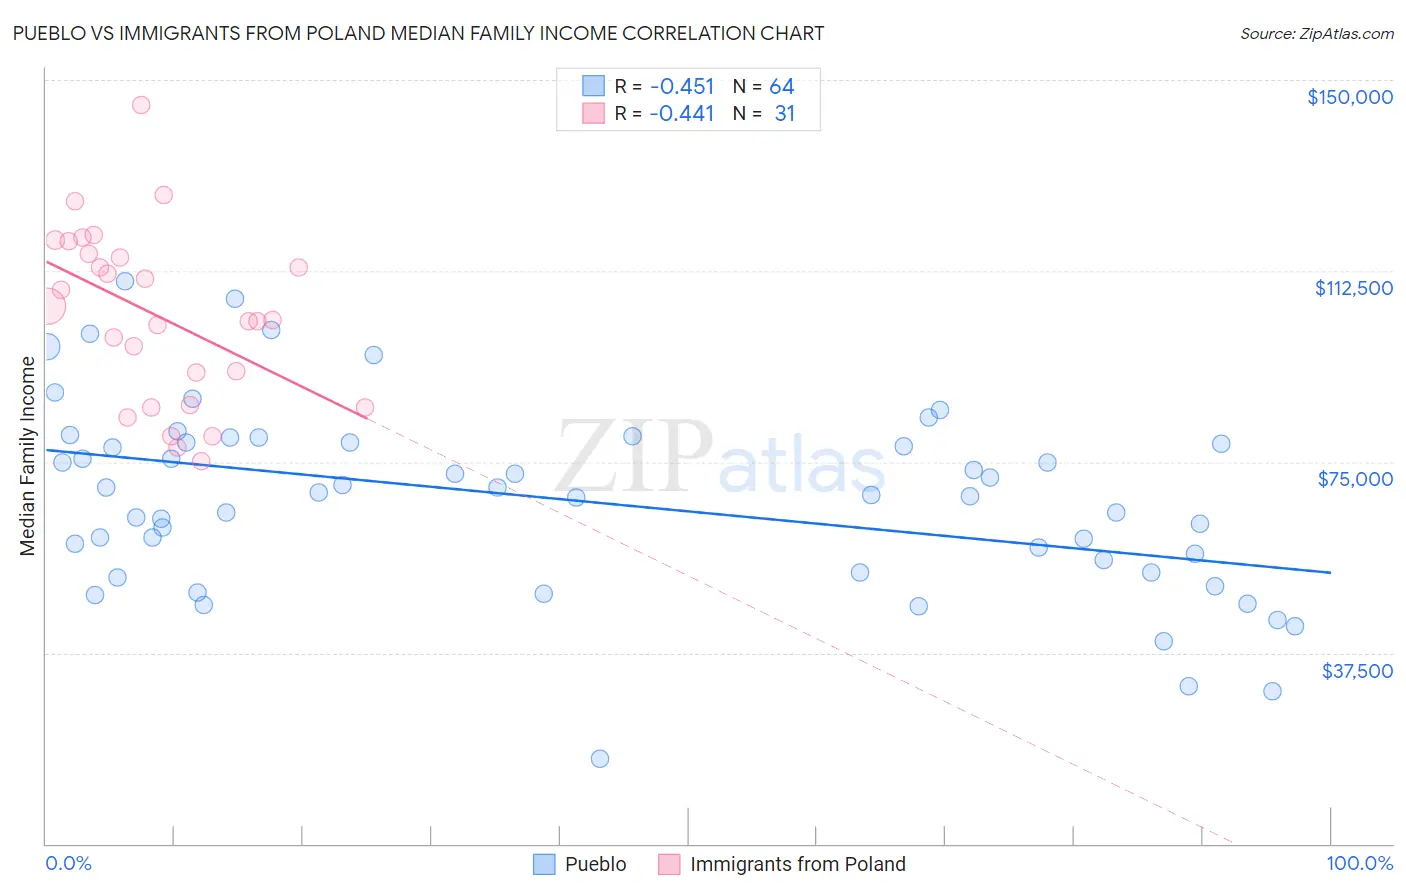
Pueblo vs Immigrants from Poland Median Family Income Correlation Chart
The statistical analysis conducted on geographies consisting of 120,047,767 people shows a moderate negative correlation between the proportion of Pueblo and median family income in the United States with a correlation coefficient (R) of -0.451 and weighted average of $76,880. Similarly, the statistical analysis conducted on geographies consisting of 304,741,932 people shows a moderate negative correlation between the proportion of Immigrants from Poland and median family income in the United States with a correlation coefficient (R) of -0.441 and weighted average of $108,570, a difference of 41.2%.
Median Family Income Correlation Summary
| Measurement | Pueblo | Immigrants from Poland |
| Minimum | $16,806 | $75,129 |
| Maximum | $110,375 | $144,968 |
| Range | $93,569 | $69,839 |
| Mean | $67,508 | $103,726 |
| Median | $68,832 | $102,831 |
| Interquartile 25% (IQ1) | $54,583 | $86,137 |
| Interquartile 75% (IQ3) | $78,820 | $115,861 |
| Interquartile Range (IQR) | $24,237 | $29,724 |
| Standard Deviation (Sample) | $18,534 | $16,903 |
| Standard Deviation (Population) | $18,389 | $16,628 |
Similar Demographics by Median Family Income
Demographics Similar to Pueblo by Median Family Income
In terms of median family income, the demographic groups most similar to Pueblo are Crow ($76,605, a difference of 0.36%), Hopi ($77,188, a difference of 0.40%), Pima ($77,431, a difference of 0.72%), Immigrants from Yemen ($77,457, a difference of 0.75%), and Houma ($76,188, a difference of 0.91%).
| Demographics | Rating | Rank | Median Family Income |
| Kiowa | 0.0 /100 | #333 | Tragic $80,885 |
| Menominee | 0.0 /100 | #334 | Tragic $79,563 |
| Yup'ik | 0.0 /100 | #335 | Tragic $79,290 |
| Immigrants | Cuba | 0.0 /100 | #336 | Tragic $78,249 |
| Yuman | 0.0 /100 | #337 | Tragic $78,055 |
| Immigrants | Yemen | 0.0 /100 | #338 | Tragic $77,457 |
| Pima | 0.0 /100 | #339 | Tragic $77,431 |
| Hopi | 0.0 /100 | #340 | Tragic $77,188 |
| Pueblo | 0.0 /100 | #341 | Tragic $76,880 |
| Crow | 0.0 /100 | #342 | Tragic $76,605 |
| Houma | 0.0 /100 | #343 | Tragic $76,188 |
| Tohono O'odham | 0.0 /100 | #344 | Tragic $72,193 |
| Navajo | 0.0 /100 | #345 | Tragic $70,989 |
| Puerto Ricans | 0.0 /100 | #346 | Tragic $70,423 |
| Lumbee | 0.0 /100 | #347 | Tragic $68,679 |
Demographics Similar to Immigrants from Poland by Median Family Income
In terms of median family income, the demographic groups most similar to Immigrants from Poland are Immigrants from Saudi Arabia ($108,544, a difference of 0.020%), Polish ($108,507, a difference of 0.060%), Swedish ($108,499, a difference of 0.070%), Immigrants from Western Asia ($108,691, a difference of 0.11%), and British ($108,705, a difference of 0.12%).
| Demographics | Rating | Rank | Median Family Income |
| Syrians | 96.7 /100 | #105 | Exceptional $109,299 |
| Albanians | 96.4 /100 | #106 | Exceptional $109,136 |
| Immigrants | North Macedonia | 96.4 /100 | #107 | Exceptional $109,136 |
| Immigrants | Zimbabwe | 95.9 /100 | #108 | Exceptional $108,830 |
| Immigrants | Afghanistan | 95.6 /100 | #109 | Exceptional $108,709 |
| British | 95.6 /100 | #110 | Exceptional $108,705 |
| Immigrants | Western Asia | 95.6 /100 | #111 | Exceptional $108,691 |
| Immigrants | Poland | 95.3 /100 | #112 | Exceptional $108,570 |
| Immigrants | Saudi Arabia | 95.2 /100 | #113 | Exceptional $108,544 |
| Poles | 95.2 /100 | #114 | Exceptional $108,507 |
| Swedes | 95.1 /100 | #115 | Exceptional $108,499 |
| Chileans | 95.0 /100 | #116 | Exceptional $108,429 |
| Immigrants | Philippines | 94.6 /100 | #117 | Exceptional $108,288 |
| Ethiopians | 94.5 /100 | #118 | Exceptional $108,251 |
| Sri Lankans | 94.5 /100 | #119 | Exceptional $108,234 |