Pueblo vs Immigrants from Congo Householder Income Over 65 years
COMPARE
Pueblo
Immigrants from Congo
Householder Income Over 65 years
Householder Income Over 65 years Comparison
Pueblo
Immigrants from Congo
$52,930
HOUSEHOLDER INCOME OVER 65 YEARS
0.0/ 100
METRIC RATING
305th/ 347
METRIC RANK
$51,393
HOUSEHOLDER INCOME OVER 65 YEARS
0.0/ 100
METRIC RATING
324th/ 347
METRIC RANK
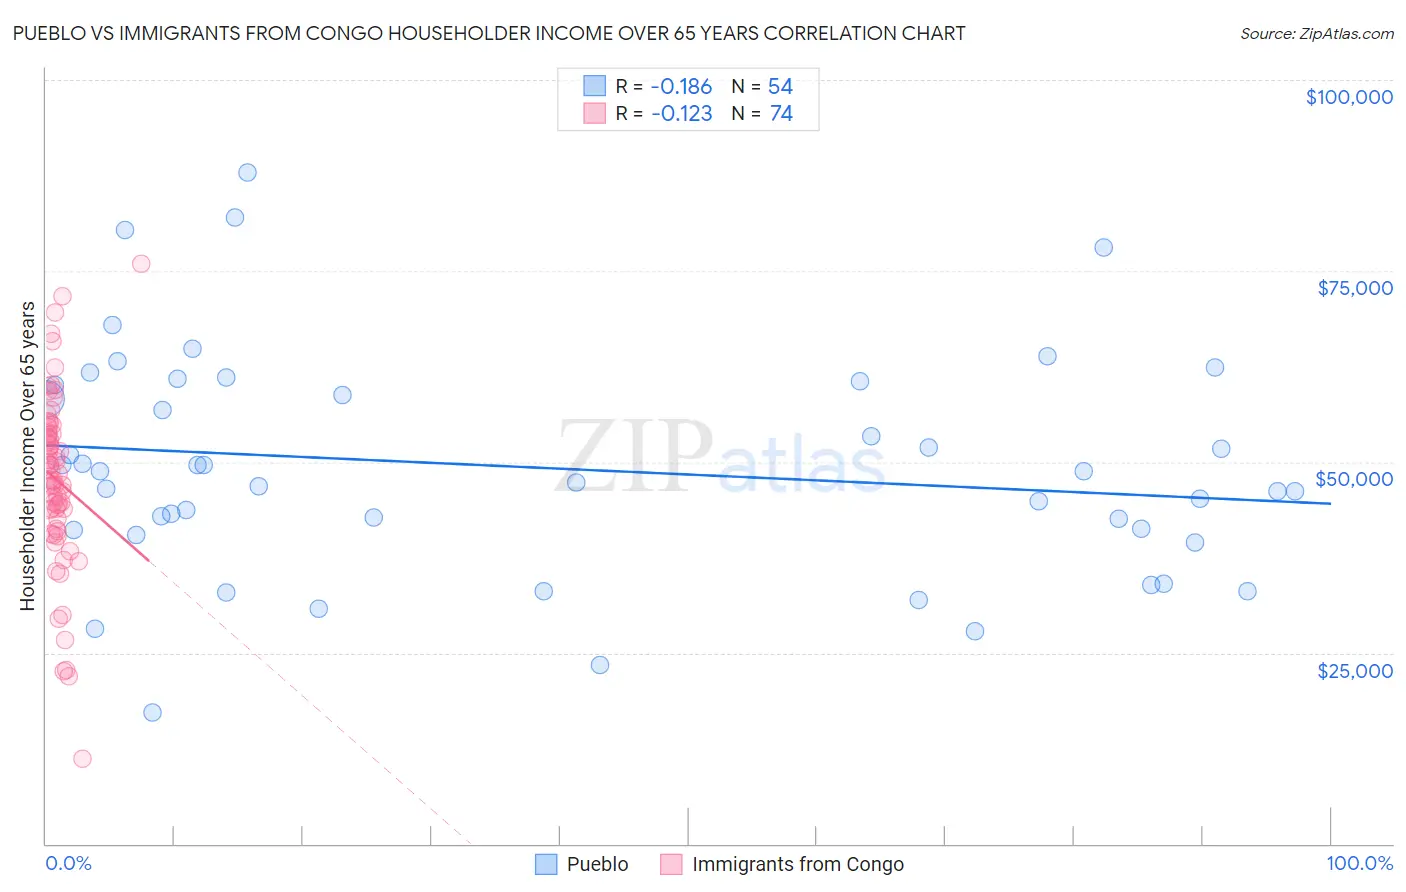
Pueblo vs Immigrants from Congo Householder Income Over 65 years Correlation Chart
The statistical analysis conducted on geographies consisting of 119,861,593 people shows a poor negative correlation between the proportion of Pueblo and household income with householder over the age of 65 in the United States with a correlation coefficient (R) of -0.186 and weighted average of $52,930. Similarly, the statistical analysis conducted on geographies consisting of 92,030,146 people shows a poor negative correlation between the proportion of Immigrants from Congo and household income with householder over the age of 65 in the United States with a correlation coefficient (R) of -0.123 and weighted average of $51,393, a difference of 3.0%.
Householder Income Over 65 years Correlation Summary
| Measurement | Pueblo | Immigrants from Congo |
| Minimum | $17,188 | $11,111 |
| Maximum | $87,917 | $76,000 |
| Range | $70,729 | $64,889 |
| Mean | $49,255 | $47,689 |
| Median | $48,042 | $48,011 |
| Interquartile 25% (IQ1) | $41,107 | $42,512 |
| Interquartile 75% (IQ3) | $60,136 | $53,762 |
| Interquartile Range (IQR) | $19,029 | $11,250 |
| Standard Deviation (Sample) | $14,756 | $11,475 |
| Standard Deviation (Population) | $14,619 | $11,397 |
Demographics Similar to Pueblo and Immigrants from Congo by Householder Income Over 65 years
In terms of householder income over 65 years, the demographic groups most similar to Pueblo are Ute ($52,949, a difference of 0.040%), Pennsylvania German ($52,888, a difference of 0.080%), Hispanic or Latino ($52,832, a difference of 0.19%), Immigrants from Mexico ($52,801, a difference of 0.24%), and Honduran ($52,634, a difference of 0.56%). Similarly, the demographic groups most similar to Immigrants from Congo are Cajun ($51,397, a difference of 0.010%), British West Indian ($51,463, a difference of 0.13%), Menominee ($51,719, a difference of 0.63%), Colville ($51,739, a difference of 0.67%), and Immigrants from Honduras ($51,888, a difference of 0.96%).
| Demographics | Rating | Rank | Householder Income Over 65 years |
| Ute | 0.0 /100 | #304 | Tragic $52,949 |
| Pueblo | 0.0 /100 | #305 | Tragic $52,930 |
| Pennsylvania Germans | 0.0 /100 | #306 | Tragic $52,888 |
| Hispanics or Latinos | 0.0 /100 | #307 | Tragic $52,832 |
| Immigrants | Mexico | 0.0 /100 | #308 | Tragic $52,801 |
| Hondurans | 0.0 /100 | #309 | Tragic $52,634 |
| Sioux | 0.0 /100 | #310 | Tragic $52,509 |
| Seminole | 0.0 /100 | #311 | Tragic $52,373 |
| Immigrants | Azores | 0.0 /100 | #312 | Tragic $52,121 |
| Immigrants | Nicaragua | 0.0 /100 | #313 | Tragic $52,085 |
| Natives/Alaskans | 0.0 /100 | #314 | Tragic $52,081 |
| U.S. Virgin Islanders | 0.0 /100 | #315 | Tragic $52,072 |
| Creek | 0.0 /100 | #316 | Tragic $51,949 |
| Immigrants | St. Vincent and the Grenadines | 0.0 /100 | #317 | Tragic $51,922 |
| Haitians | 0.0 /100 | #318 | Tragic $51,912 |
| Immigrants | Honduras | 0.0 /100 | #319 | Tragic $51,888 |
| Colville | 0.0 /100 | #320 | Tragic $51,739 |
| Menominee | 0.0 /100 | #321 | Tragic $51,719 |
| British West Indians | 0.0 /100 | #322 | Tragic $51,463 |
| Cajuns | 0.0 /100 | #323 | Tragic $51,397 |
| Immigrants | Congo | 0.0 /100 | #324 | Tragic $51,393 |