Pueblo vs Armenian Median Female Earnings
COMPARE
Pueblo
Armenian
Median Female Earnings
Median Female Earnings Comparison
Pueblo
Armenians
$32,564
MEDIAN FEMALE EARNINGS
0.0/ 100
METRIC RATING
343rd/ 347
METRIC RANK
$42,212
MEDIAN FEMALE EARNINGS
99.5/ 100
METRIC RATING
84th/ 347
METRIC RANK
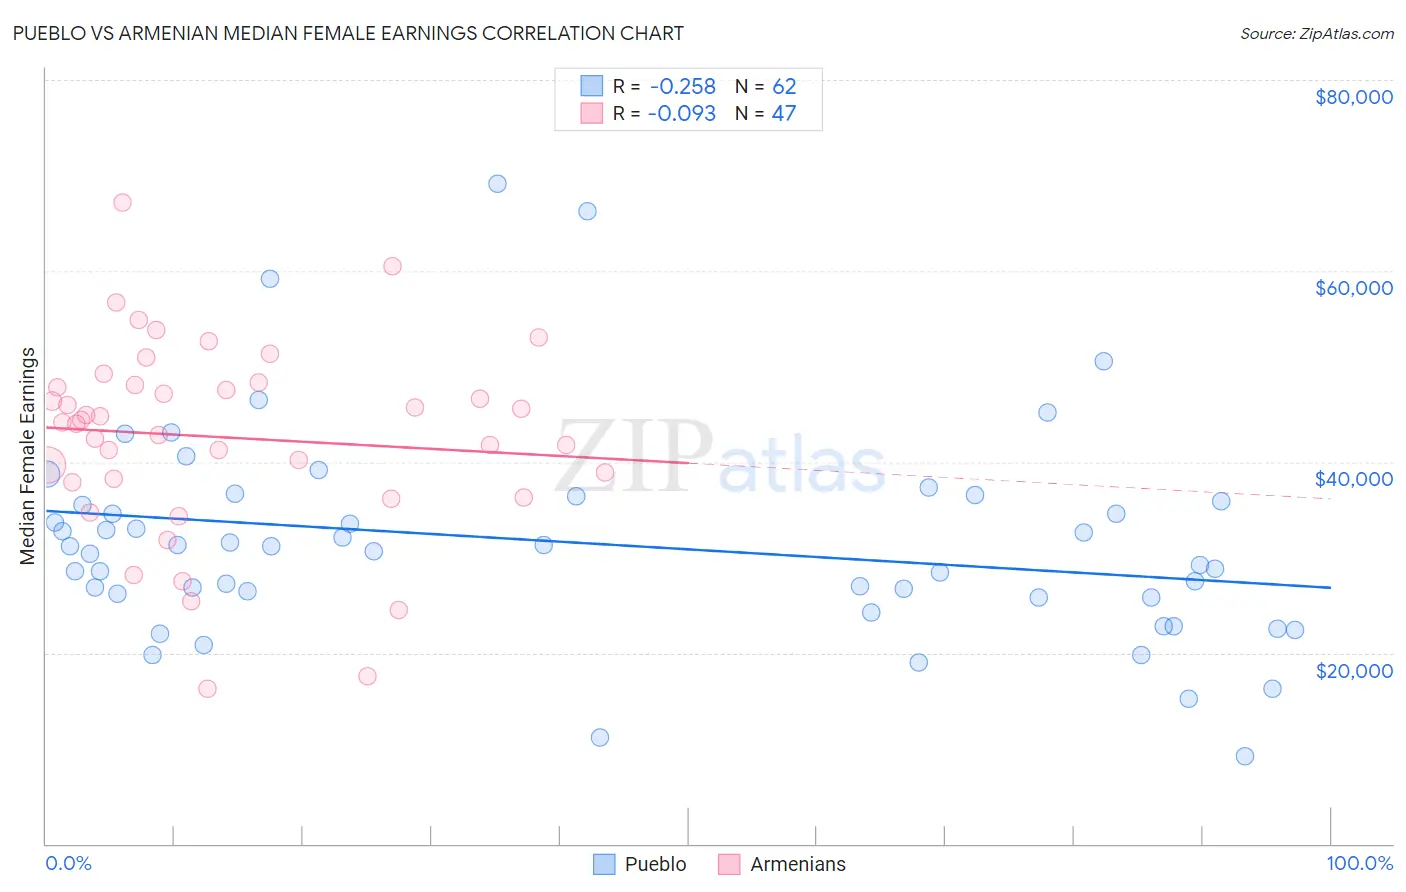
Pueblo vs Armenian Median Female Earnings Correlation Chart
The statistical analysis conducted on geographies consisting of 120,036,612 people shows a weak negative correlation between the proportion of Pueblo and median female earnings in the United States with a correlation coefficient (R) of -0.258 and weighted average of $32,564. Similarly, the statistical analysis conducted on geographies consisting of 310,826,336 people shows a slight negative correlation between the proportion of Armenians and median female earnings in the United States with a correlation coefficient (R) of -0.093 and weighted average of $42,212, a difference of 29.6%.
Median Female Earnings Correlation Summary
| Measurement | Pueblo | Armenian |
| Minimum | $9,219 | $16,250 |
| Maximum | $69,074 | $67,117 |
| Range | $59,855 | $50,867 |
| Mean | $31,512 | $42,561 |
| Median | $30,863 | $44,186 |
| Interquartile 25% (IQ1) | $25,792 | $37,899 |
| Interquartile 75% (IQ3) | $35,833 | $48,091 |
| Interquartile Range (IQR) | $10,041 | $10,192 |
| Standard Deviation (Sample) | $11,084 | $10,212 |
| Standard Deviation (Population) | $10,994 | $10,102 |
Similar Demographics by Median Female Earnings
Demographics Similar to Pueblo by Median Female Earnings
In terms of median female earnings, the demographic groups most similar to Pueblo are Lumbee ($32,500, a difference of 0.20%), Yup'ik ($32,730, a difference of 0.51%), Navajo ($33,046, a difference of 1.5%), Tohono O'odham ($33,205, a difference of 2.0%), and Immigrants from Mexico ($33,236, a difference of 2.1%).
| Demographics | Rating | Rank | Median Female Earnings |
| Mexicans | 0.0 /100 | #333 | Tragic $33,664 |
| Spanish American Indians | 0.0 /100 | #334 | Tragic $33,625 |
| Creek | 0.0 /100 | #335 | Tragic $33,437 |
| Ottawa | 0.0 /100 | #336 | Tragic $33,378 |
| Yakama | 0.0 /100 | #337 | Tragic $33,354 |
| Immigrants | Cuba | 0.0 /100 | #338 | Tragic $33,291 |
| Immigrants | Mexico | 0.0 /100 | #339 | Tragic $33,236 |
| Tohono O'odham | 0.0 /100 | #340 | Tragic $33,205 |
| Navajo | 0.0 /100 | #341 | Tragic $33,046 |
| Yup'ik | 0.0 /100 | #342 | Tragic $32,730 |
| Pueblo | 0.0 /100 | #343 | Tragic $32,564 |
| Lumbee | 0.0 /100 | #344 | Tragic $32,500 |
| Puerto Ricans | 0.0 /100 | #345 | Tragic $31,560 |
| Arapaho | 0.0 /100 | #346 | Tragic $31,489 |
| Houma | 0.0 /100 | #347 | Tragic $30,343 |
Demographics Similar to Armenians by Median Female Earnings
In terms of median female earnings, the demographic groups most similar to Armenians are Immigrants from Sierra Leone ($42,214, a difference of 0.010%), Immigrants from Morocco ($42,229, a difference of 0.040%), Immigrants from Southern Europe ($42,275, a difference of 0.15%), Laotian ($42,133, a difference of 0.19%), and Immigrants from Moldova ($42,304, a difference of 0.22%).
| Demographics | Rating | Rank | Median Female Earnings |
| Immigrants | Albania | 99.6 /100 | #77 | Exceptional $42,388 |
| Immigrants | Kazakhstan | 99.6 /100 | #78 | Exceptional $42,386 |
| Greeks | 99.6 /100 | #79 | Exceptional $42,336 |
| Immigrants | Moldova | 99.6 /100 | #80 | Exceptional $42,304 |
| Immigrants | Southern Europe | 99.5 /100 | #81 | Exceptional $42,275 |
| Immigrants | Morocco | 99.5 /100 | #82 | Exceptional $42,229 |
| Immigrants | Sierra Leone | 99.5 /100 | #83 | Exceptional $42,214 |
| Armenians | 99.5 /100 | #84 | Exceptional $42,212 |
| Laotians | 99.4 /100 | #85 | Exceptional $42,133 |
| Immigrants | St. Vincent and the Grenadines | 99.3 /100 | #86 | Exceptional $42,108 |
| Lithuanians | 99.3 /100 | #87 | Exceptional $42,108 |
| Immigrants | Northern Africa | 99.3 /100 | #88 | Exceptional $42,084 |
| Immigrants | Afghanistan | 99.3 /100 | #89 | Exceptional $42,055 |
| Ukrainians | 99.2 /100 | #90 | Exceptional $42,015 |
| Immigrants | Western Europe | 99.2 /100 | #91 | Exceptional $41,990 |