Potawatomi vs Indonesian Householder Income Ages 25 - 44 years
COMPARE
Potawatomi
Indonesian
Householder Income Ages 25 - 44 years
Householder Income Ages 25 - 44 years Comparison
Potawatomi
Indonesians
$81,774
HOUSEHOLDER INCOME AGES 25 - 44 YEARS
0.1/ 100
METRIC RATING
291st/ 347
METRIC RANK
$79,543
HOUSEHOLDER INCOME AGES 25 - 44 YEARS
0.0/ 100
METRIC RATING
311th/ 347
METRIC RANK
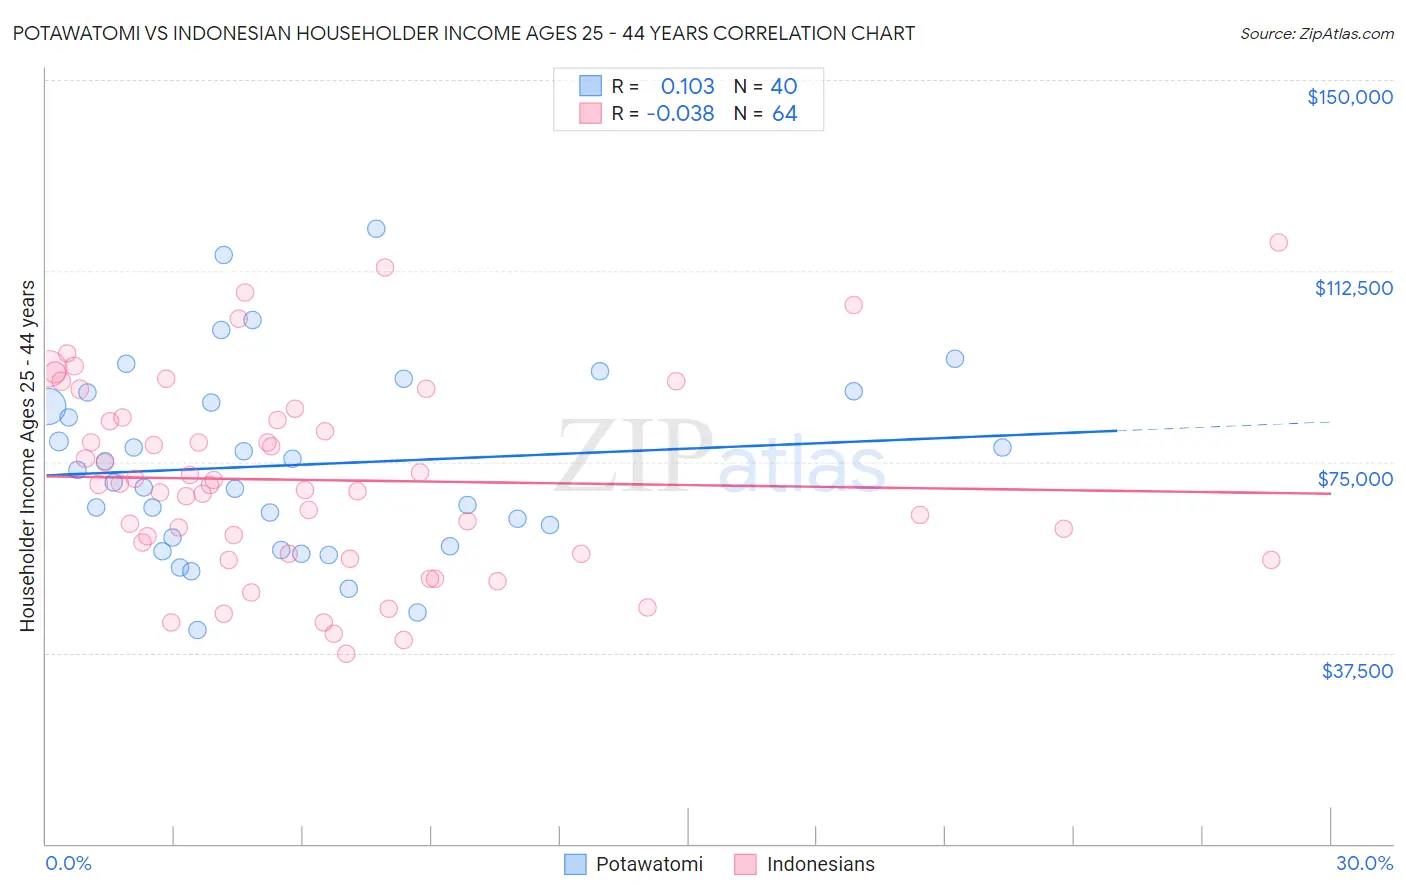
Potawatomi vs Indonesian Householder Income Ages 25 - 44 years Correlation Chart
The statistical analysis conducted on geographies consisting of 117,622,599 people shows a poor positive correlation between the proportion of Potawatomi and household income with householder between the ages 25 and 44 in the United States with a correlation coefficient (R) of 0.103 and weighted average of $81,774. Similarly, the statistical analysis conducted on geographies consisting of 162,548,199 people shows no correlation between the proportion of Indonesians and household income with householder between the ages 25 and 44 in the United States with a correlation coefficient (R) of -0.038 and weighted average of $79,543, a difference of 2.8%.
Householder Income Ages 25 - 44 years Correlation Summary
| Measurement | Potawatomi | Indonesian |
| Minimum | $41,983 | $37,365 |
| Maximum | $120,714 | $118,125 |
| Range | $78,731 | $80,760 |
| Mean | $74,403 | $71,416 |
| Median | $72,124 | $70,496 |
| Interquartile 25% (IQ1) | $59,264 | $56,977 |
| Interquartile 75% (IQ3) | $87,578 | $83,474 |
| Interquartile Range (IQR) | $28,314 | $26,497 |
| Standard Deviation (Sample) | $18,398 | $18,886 |
| Standard Deviation (Population) | $18,166 | $18,738 |
Demographics Similar to Potawatomi and Indonesians by Householder Income Ages 25 - 44 years
In terms of householder income ages 25 - 44 years, the demographic groups most similar to Potawatomi are Yaqui ($81,656, a difference of 0.14%), Blackfeet ($81,531, a difference of 0.30%), Cuban ($81,483, a difference of 0.36%), Bangladeshi ($81,363, a difference of 0.50%), and Immigrants from Dominica ($81,351, a difference of 0.52%). Similarly, the demographic groups most similar to Indonesians are Fijian ($79,956, a difference of 0.52%), Chippewa ($80,005, a difference of 0.58%), Immigrants from Central America ($80,012, a difference of 0.59%), Haitian ($80,055, a difference of 0.64%), and Apache ($80,260, a difference of 0.90%).
| Demographics | Rating | Rank | Householder Income Ages 25 - 44 years |
| Potawatomi | 0.1 /100 | #291 | Tragic $81,774 |
| Yaqui | 0.1 /100 | #292 | Tragic $81,656 |
| Blackfeet | 0.1 /100 | #293 | Tragic $81,531 |
| Cubans | 0.1 /100 | #294 | Tragic $81,483 |
| Bangladeshis | 0.1 /100 | #295 | Tragic $81,363 |
| Immigrants | Dominica | 0.1 /100 | #296 | Tragic $81,351 |
| Immigrants | Guatemala | 0.1 /100 | #297 | Tragic $81,341 |
| Dominicans | 0.1 /100 | #298 | Tragic $81,229 |
| Immigrants | Liberia | 0.1 /100 | #299 | Tragic $80,863 |
| Cherokee | 0.0 /100 | #300 | Tragic $80,843 |
| Immigrants | Micronesia | 0.0 /100 | #301 | Tragic $80,544 |
| Hispanics or Latinos | 0.0 /100 | #302 | Tragic $80,515 |
| Mexicans | 0.0 /100 | #303 | Tragic $80,427 |
| Immigrants | Caribbean | 0.0 /100 | #304 | Tragic $80,326 |
| Immigrants | Dominican Republic | 0.0 /100 | #305 | Tragic $80,319 |
| Apache | 0.0 /100 | #306 | Tragic $80,260 |
| Haitians | 0.0 /100 | #307 | Tragic $80,055 |
| Immigrants | Central America | 0.0 /100 | #308 | Tragic $80,012 |
| Chippewa | 0.0 /100 | #309 | Tragic $80,005 |
| Fijians | 0.0 /100 | #310 | Tragic $79,956 |
| Indonesians | 0.0 /100 | #311 | Tragic $79,543 |