Portuguese vs Comanche Median Female Earnings
COMPARE
Portuguese
Comanche
Median Female Earnings
Median Female Earnings Comparison
Portuguese
Comanche
$40,177
MEDIAN FEMALE EARNINGS
73.0/ 100
METRIC RATING
157th/ 347
METRIC RANK
$35,661
MEDIAN FEMALE EARNINGS
0.0/ 100
METRIC RATING
295th/ 347
METRIC RANK
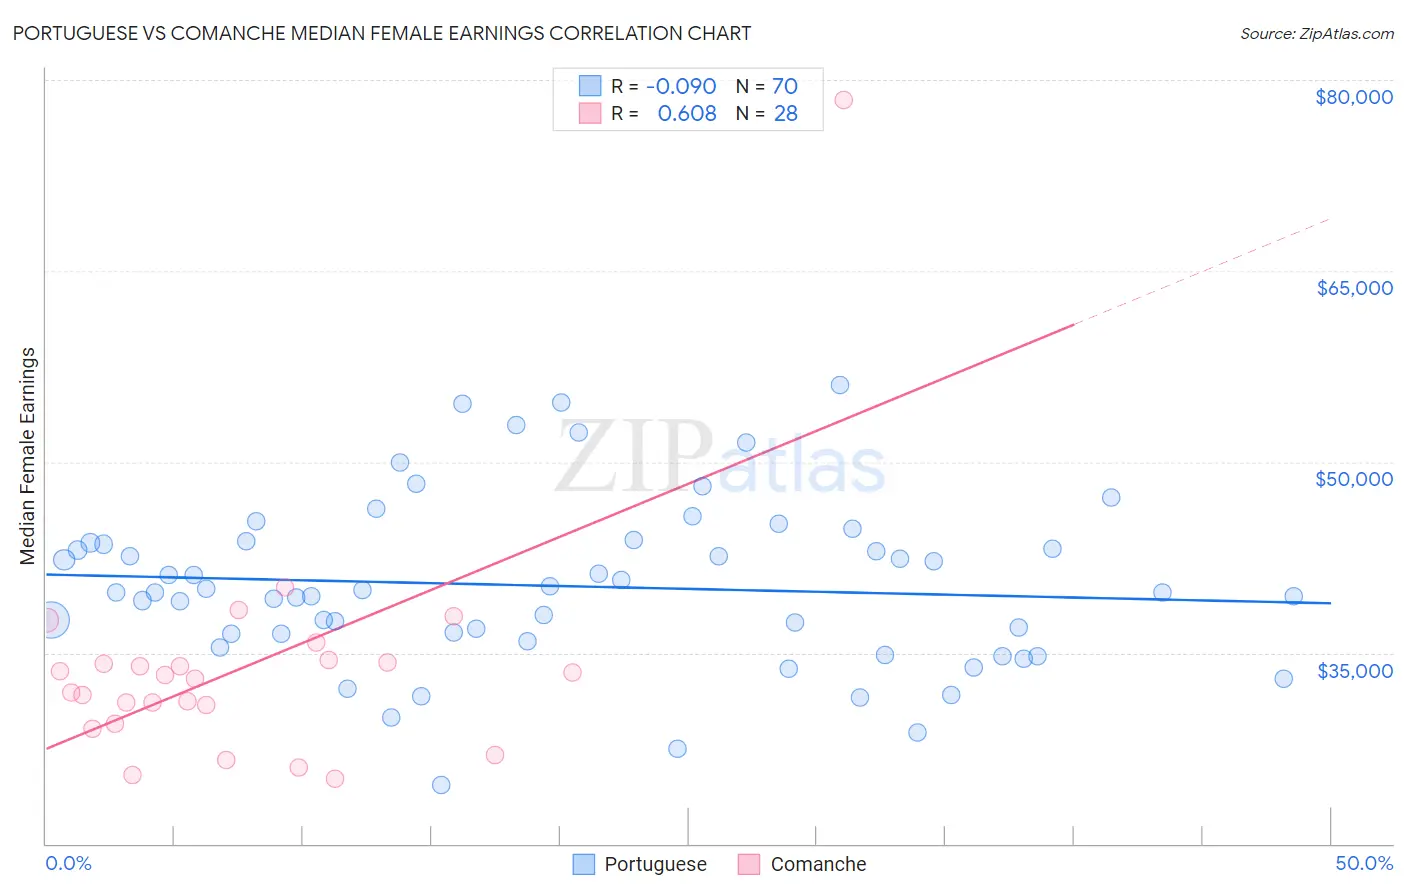
Portuguese vs Comanche Median Female Earnings Correlation Chart
The statistical analysis conducted on geographies consisting of 449,940,574 people shows a slight negative correlation between the proportion of Portuguese and median female earnings in the United States with a correlation coefficient (R) of -0.090 and weighted average of $40,177. Similarly, the statistical analysis conducted on geographies consisting of 109,756,357 people shows a significant positive correlation between the proportion of Comanche and median female earnings in the United States with a correlation coefficient (R) of 0.608 and weighted average of $35,661, a difference of 12.7%.
Median Female Earnings Correlation Summary
| Measurement | Portuguese | Comanche |
| Minimum | $24,606 | $25,100 |
| Maximum | $56,053 | $78,452 |
| Range | $31,447 | $53,352 |
| Mean | $40,249 | $33,877 |
| Median | $39,749 | $33,076 |
| Interquartile 25% (IQ1) | $36,452 | $30,131 |
| Interquartile 75% (IQ3) | $43,632 | $34,372 |
| Interquartile Range (IQR) | $7,179 | $4,241 |
| Standard Deviation (Sample) | $6,533 | $9,585 |
| Standard Deviation (Population) | $6,486 | $9,413 |
Similar Demographics by Median Female Earnings
Demographics Similar to Portuguese by Median Female Earnings
In terms of median female earnings, the demographic groups most similar to Portuguese are Immigrants from Senegal ($40,157, a difference of 0.050%), Immigrants from Vietnam ($40,153, a difference of 0.060%), Peruvian ($40,234, a difference of 0.14%), Immigrants from Africa ($40,257, a difference of 0.20%), and Inupiat ($40,080, a difference of 0.24%).
| Demographics | Rating | Rank | Median Female Earnings |
| Immigrants | Chile | 79.6 /100 | #150 | Good $40,353 |
| Immigrants | Armenia | 79.2 /100 | #151 | Good $40,340 |
| West Indians | 78.4 /100 | #152 | Good $40,317 |
| British West Indians | 77.7 /100 | #153 | Good $40,299 |
| Immigrants | Oceania | 77.6 /100 | #154 | Good $40,297 |
| Immigrants | Africa | 76.2 /100 | #155 | Good $40,257 |
| Peruvians | 75.3 /100 | #156 | Good $40,234 |
| Portuguese | 73.0 /100 | #157 | Good $40,177 |
| Immigrants | Senegal | 72.2 /100 | #158 | Good $40,157 |
| Immigrants | Vietnam | 72.0 /100 | #159 | Good $40,153 |
| Inupiat | 68.9 /100 | #160 | Good $40,080 |
| Alsatians | 68.0 /100 | #161 | Good $40,060 |
| South American Indians | 66.1 /100 | #162 | Good $40,019 |
| Lebanese | 65.5 /100 | #163 | Good $40,006 |
| Immigrants | Saudi Arabia | 62.9 /100 | #164 | Good $39,952 |
Demographics Similar to Comanche by Median Female Earnings
In terms of median female earnings, the demographic groups most similar to Comanche are Cheyenne ($35,673, a difference of 0.030%), Guatemalan ($35,695, a difference of 0.090%), Mexican American Indian ($35,629, a difference of 0.090%), American ($35,777, a difference of 0.32%), and Hmong ($35,498, a difference of 0.46%).
| Demographics | Rating | Rank | Median Female Earnings |
| Immigrants | Zaire | 0.0 /100 | #288 | Tragic $36,017 |
| Bangladeshis | 0.0 /100 | #289 | Tragic $35,960 |
| Central American Indians | 0.0 /100 | #290 | Tragic $35,930 |
| Blackfeet | 0.0 /100 | #291 | Tragic $35,864 |
| Americans | 0.0 /100 | #292 | Tragic $35,777 |
| Guatemalans | 0.0 /100 | #293 | Tragic $35,695 |
| Cheyenne | 0.0 /100 | #294 | Tragic $35,673 |
| Comanche | 0.0 /100 | #295 | Tragic $35,661 |
| Mexican American Indians | 0.0 /100 | #296 | Tragic $35,629 |
| Hmong | 0.0 /100 | #297 | Tragic $35,498 |
| Immigrants | Micronesia | 0.0 /100 | #298 | Tragic $35,477 |
| Immigrants | Guatemala | 0.0 /100 | #299 | Tragic $35,444 |
| Yuman | 0.0 /100 | #300 | Tragic $35,377 |
| Pima | 0.0 /100 | #301 | Tragic $35,326 |
| Blacks/African Americans | 0.0 /100 | #302 | Tragic $35,315 |