Portuguese vs Bhutanese Median Earnings
COMPARE
Portuguese
Bhutanese
Median Earnings
Median Earnings Comparison
Portuguese
Bhutanese
$48,032
MEDIAN EARNINGS
90.4/ 100
METRIC RATING
135th/ 347
METRIC RANK
$52,297
MEDIAN EARNINGS
100.0/ 100
METRIC RATING
46th/ 347
METRIC RANK
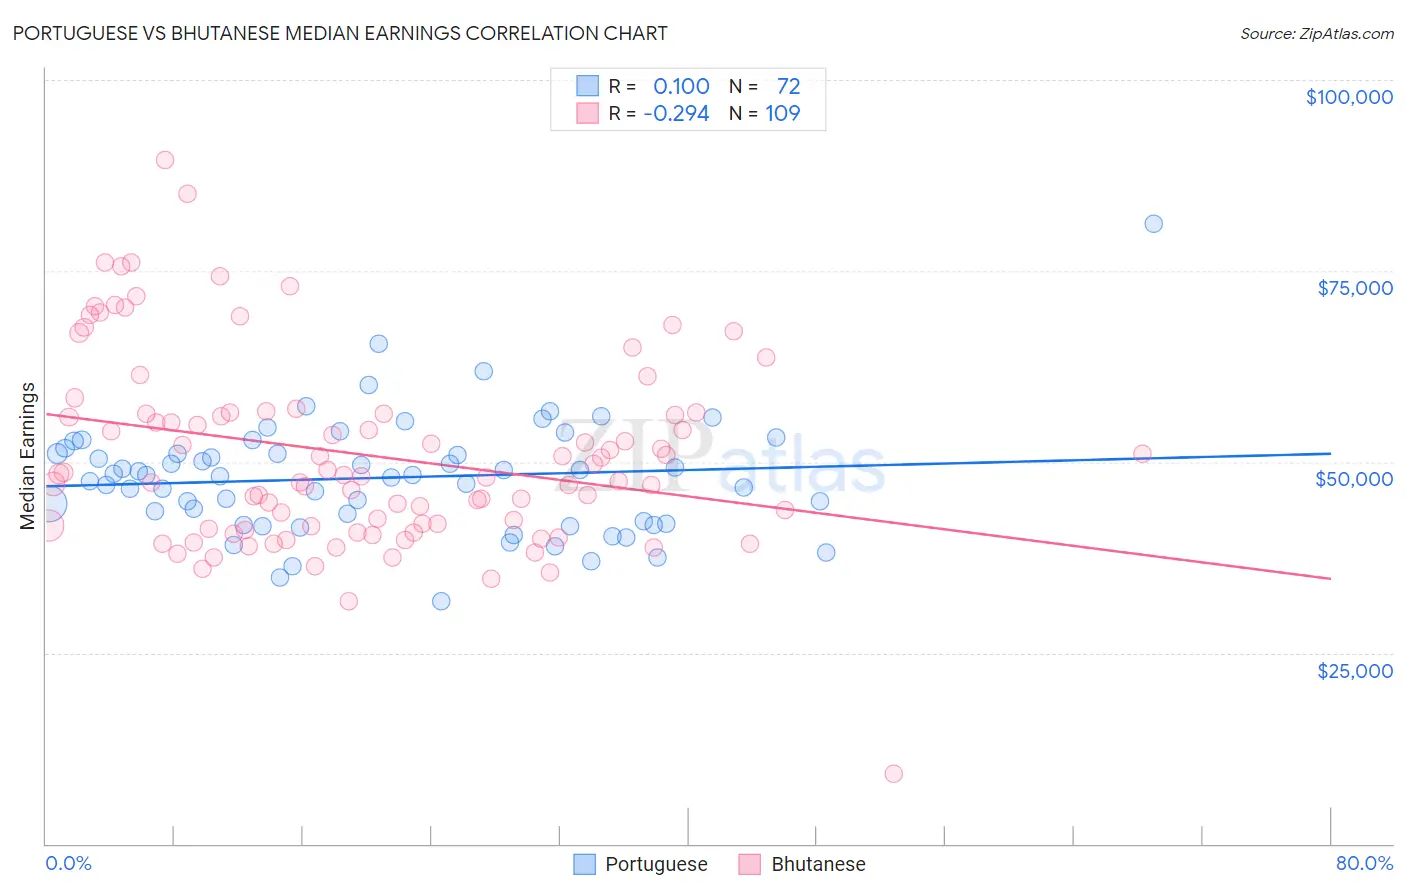
Portuguese vs Bhutanese Median Earnings Correlation Chart
The statistical analysis conducted on geographies consisting of 450,292,594 people shows a poor positive correlation between the proportion of Portuguese and median earnings in the United States with a correlation coefficient (R) of 0.100 and weighted average of $48,032. Similarly, the statistical analysis conducted on geographies consisting of 455,560,671 people shows a weak negative correlation between the proportion of Bhutanese and median earnings in the United States with a correlation coefficient (R) of -0.294 and weighted average of $52,297, a difference of 8.9%.
Median Earnings Correlation Summary
| Measurement | Portuguese | Bhutanese |
| Minimum | $31,738 | $9,211 |
| Maximum | $81,250 | $89,590 |
| Range | $49,512 | $80,379 |
| Mean | $47,922 | $50,906 |
| Median | $48,184 | $48,356 |
| Interquartile 25% (IQ1) | $42,050 | $41,435 |
| Interquartile 75% (IQ3) | $51,472 | $56,370 |
| Interquartile Range (IQR) | $9,423 | $14,935 |
| Standard Deviation (Sample) | $7,646 | $12,596 |
| Standard Deviation (Population) | $7,593 | $12,538 |
Similar Demographics by Median Earnings
Demographics Similar to Portuguese by Median Earnings
In terms of median earnings, the demographic groups most similar to Portuguese are Immigrants from Uganda ($48,041, a difference of 0.020%), Sri Lankan ($48,040, a difference of 0.020%), Slovene ($47,995, a difference of 0.080%), Immigrants from Nepal ($47,925, a difference of 0.22%), and European ($47,915, a difference of 0.25%).
| Demographics | Rating | Rank | Median Earnings |
| Immigrants | Philippines | 92.9 /100 | #128 | Exceptional $48,266 |
| Pakistanis | 92.8 /100 | #129 | Exceptional $48,254 |
| Zimbabweans | 92.6 /100 | #130 | Exceptional $48,229 |
| Lebanese | 92.5 /100 | #131 | Exceptional $48,226 |
| British | 92.2 /100 | #132 | Exceptional $48,189 |
| Immigrants | Uganda | 90.5 /100 | #133 | Exceptional $48,041 |
| Sri Lankans | 90.5 /100 | #134 | Exceptional $48,040 |
| Portuguese | 90.4 /100 | #135 | Exceptional $48,032 |
| Slovenes | 90.0 /100 | #136 | Excellent $47,995 |
| Immigrants | Nepal | 89.0 /100 | #137 | Excellent $47,925 |
| Europeans | 88.9 /100 | #138 | Excellent $47,915 |
| Canadians | 88.8 /100 | #139 | Excellent $47,911 |
| Taiwanese | 88.7 /100 | #140 | Excellent $47,902 |
| Immigrants | Sierra Leone | 88.3 /100 | #141 | Excellent $47,875 |
| Ugandans | 88.0 /100 | #142 | Excellent $47,854 |
Demographics Similar to Bhutanese by Median Earnings
In terms of median earnings, the demographic groups most similar to Bhutanese are Australian ($52,294, a difference of 0.010%), Immigrants from Czechoslovakia ($52,361, a difference of 0.12%), Immigrants from Europe ($52,195, a difference of 0.20%), Immigrants from Malaysia ($52,514, a difference of 0.41%), and Bulgarian ($52,512, a difference of 0.41%).
| Demographics | Rating | Rank | Median Earnings |
| Immigrants | Turkey | 100.0 /100 | #39 | Exceptional $52,960 |
| Israelis | 100.0 /100 | #40 | Exceptional $52,937 |
| Immigrants | Lithuania | 100.0 /100 | #41 | Exceptional $52,769 |
| Maltese | 100.0 /100 | #42 | Exceptional $52,526 |
| Immigrants | Malaysia | 100.0 /100 | #43 | Exceptional $52,514 |
| Bulgarians | 100.0 /100 | #44 | Exceptional $52,512 |
| Immigrants | Czechoslovakia | 100.0 /100 | #45 | Exceptional $52,361 |
| Bhutanese | 100.0 /100 | #46 | Exceptional $52,297 |
| Australians | 100.0 /100 | #47 | Exceptional $52,294 |
| Immigrants | Europe | 100.0 /100 | #48 | Exceptional $52,195 |
| Bolivians | 100.0 /100 | #49 | Exceptional $52,005 |
| Immigrants | South Africa | 100.0 /100 | #50 | Exceptional $51,850 |
| Immigrants | Austria | 99.9 /100 | #51 | Exceptional $51,826 |
| Estonians | 99.9 /100 | #52 | Exceptional $51,772 |
| Immigrants | Norway | 99.9 /100 | #53 | Exceptional $51,758 |