Pennsylvania German vs Trinidadian and Tobagonian Median Earnings
COMPARE
Pennsylvania German
Trinidadian and Tobagonian
Median Earnings
Median Earnings Comparison
Pennsylvania Germans
Trinidadians and Tobagonians
$42,615
MEDIAN EARNINGS
0.5/ 100
METRIC RATING
271st/ 347
METRIC RANK
$45,820
MEDIAN EARNINGS
29.7/ 100
METRIC RATING
198th/ 347
METRIC RANK
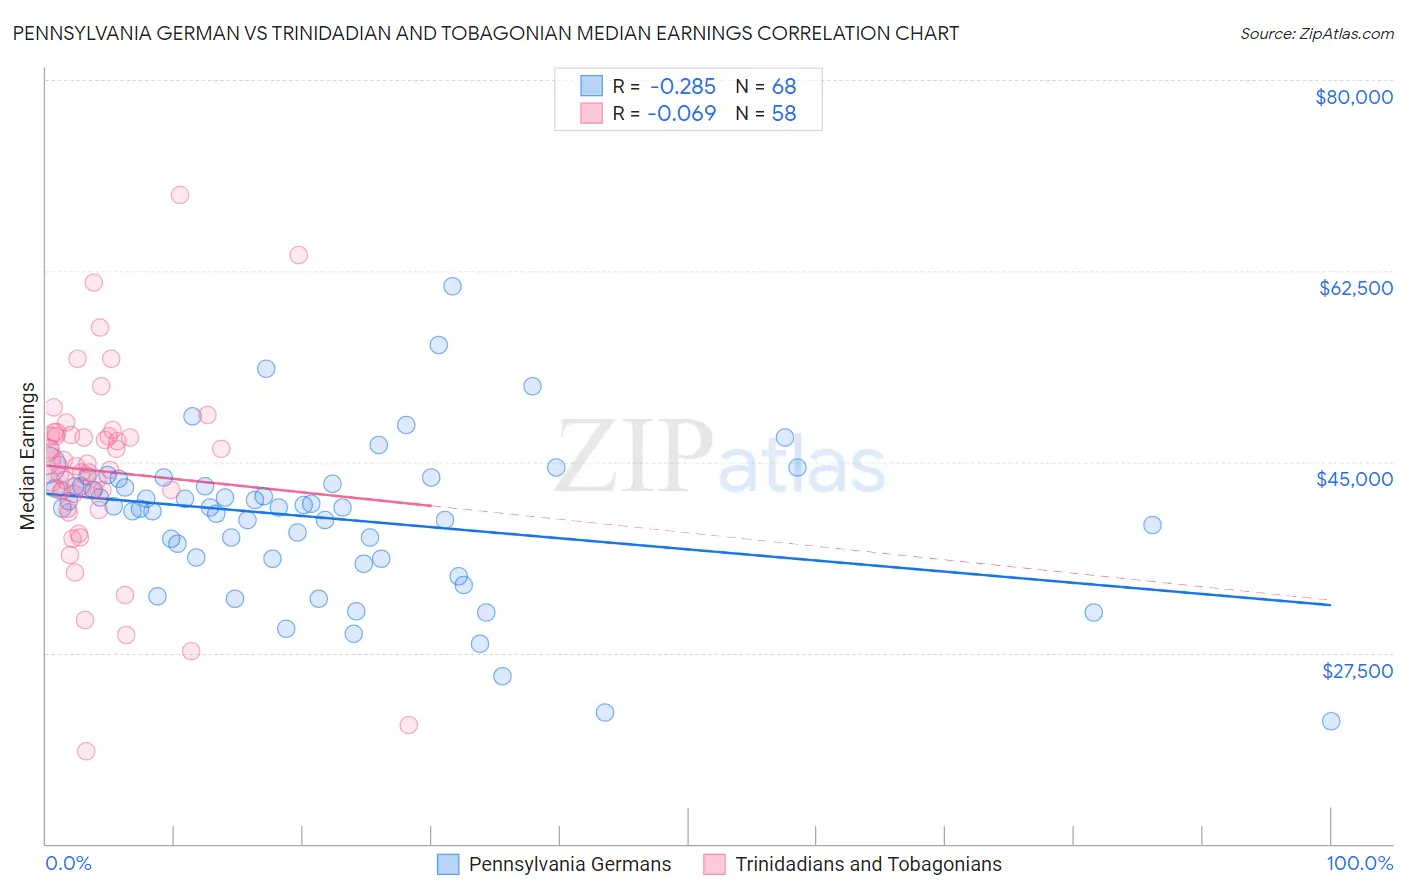
Pennsylvania German vs Trinidadian and Tobagonian Median Earnings Correlation Chart
The statistical analysis conducted on geographies consisting of 234,087,071 people shows a weak negative correlation between the proportion of Pennsylvania Germans and median earnings in the United States with a correlation coefficient (R) of -0.285 and weighted average of $42,615. Similarly, the statistical analysis conducted on geographies consisting of 219,864,725 people shows a slight negative correlation between the proportion of Trinidadians and Tobagonians and median earnings in the United States with a correlation coefficient (R) of -0.069 and weighted average of $45,820, a difference of 7.5%.
Median Earnings Correlation Summary
| Measurement | Pennsylvania German | Trinidadian and Tobagonian |
| Minimum | $21,250 | $18,432 |
| Maximum | $61,146 | $69,500 |
| Range | $39,896 | $51,068 |
| Mean | $39,881 | $44,150 |
| Median | $40,836 | $44,668 |
| Interquartile 25% (IQ1) | $36,214 | $42,022 |
| Interquartile 75% (IQ3) | $42,893 | $47,373 |
| Interquartile Range (IQR) | $6,679 | $5,351 |
| Standard Deviation (Sample) | $6,983 | $8,720 |
| Standard Deviation (Population) | $6,932 | $8,644 |
Similar Demographics by Median Earnings
Demographics Similar to Pennsylvania Germans by Median Earnings
In terms of median earnings, the demographic groups most similar to Pennsylvania Germans are Osage ($42,651, a difference of 0.090%), Belizean ($42,702, a difference of 0.21%), American ($42,742, a difference of 0.30%), Cree ($42,777, a difference of 0.38%), and Iroquois ($42,430, a difference of 0.43%).
| Demographics | Rating | Rank | Median Earnings |
| Immigrants | Liberia | 0.7 /100 | #264 | Tragic $42,923 |
| Salvadorans | 0.7 /100 | #265 | Tragic $42,912 |
| Immigrants | Laos | 0.7 /100 | #266 | Tragic $42,884 |
| Cree | 0.6 /100 | #267 | Tragic $42,777 |
| Americans | 0.6 /100 | #268 | Tragic $42,742 |
| Belizeans | 0.5 /100 | #269 | Tragic $42,702 |
| Osage | 0.5 /100 | #270 | Tragic $42,651 |
| Pennsylvania Germans | 0.5 /100 | #271 | Tragic $42,615 |
| Iroquois | 0.4 /100 | #272 | Tragic $42,430 |
| Immigrants | Dominica | 0.4 /100 | #273 | Tragic $42,420 |
| Immigrants | El Salvador | 0.4 /100 | #274 | Tragic $42,413 |
| Immigrants | Belize | 0.3 /100 | #275 | Tragic $42,339 |
| Spanish Americans | 0.3 /100 | #276 | Tragic $42,316 |
| Central Americans | 0.3 /100 | #277 | Tragic $42,280 |
| Cajuns | 0.3 /100 | #278 | Tragic $42,189 |
Demographics Similar to Trinidadians and Tobagonians by Median Earnings
In terms of median earnings, the demographic groups most similar to Trinidadians and Tobagonians are Immigrants from Barbados ($45,816, a difference of 0.010%), Immigrants from the Azores ($45,812, a difference of 0.020%), Yugoslavian ($45,846, a difference of 0.060%), Barbadian ($45,846, a difference of 0.060%), and Immigrants from St. Vincent and the Grenadines ($45,908, a difference of 0.19%).
| Demographics | Rating | Rank | Median Earnings |
| Finns | 33.4 /100 | #191 | Fair $45,940 |
| Germans | 33.2 /100 | #192 | Fair $45,935 |
| Guamanians/Chamorros | 33.2 /100 | #193 | Fair $45,933 |
| Immigrants | Costa Rica | 33.0 /100 | #194 | Fair $45,928 |
| Immigrants | St. Vincent and the Grenadines | 32.4 /100 | #195 | Fair $45,908 |
| Yugoslavians | 30.5 /100 | #196 | Fair $45,846 |
| Barbadians | 30.5 /100 | #197 | Fair $45,846 |
| Trinidadians and Tobagonians | 29.7 /100 | #198 | Fair $45,820 |
| Immigrants | Barbados | 29.6 /100 | #199 | Fair $45,816 |
| Immigrants | Azores | 29.5 /100 | #200 | Fair $45,812 |
| Celtics | 27.2 /100 | #201 | Fair $45,732 |
| Immigrants | Trinidad and Tobago | 27.1 /100 | #202 | Fair $45,729 |
| Welsh | 26.6 /100 | #203 | Fair $45,710 |
| Immigrants | Uruguay | 25.9 /100 | #204 | Fair $45,682 |
| Tongans | 25.4 /100 | #205 | Fair $45,665 |