Paraguayan vs Canadian Householder Income Under 25 years
COMPARE
Paraguayan
Canadian
Householder Income Under 25 years
Householder Income Under 25 years Comparison
Paraguayans
Canadians
$55,614
HOUSEHOLDER INCOME UNDER 25 YEARS
100.0/ 100
METRIC RATING
44th/ 347
METRIC RANK
$52,336
HOUSEHOLDER INCOME UNDER 25 YEARS
58.8/ 100
METRIC RATING
169th/ 347
METRIC RANK
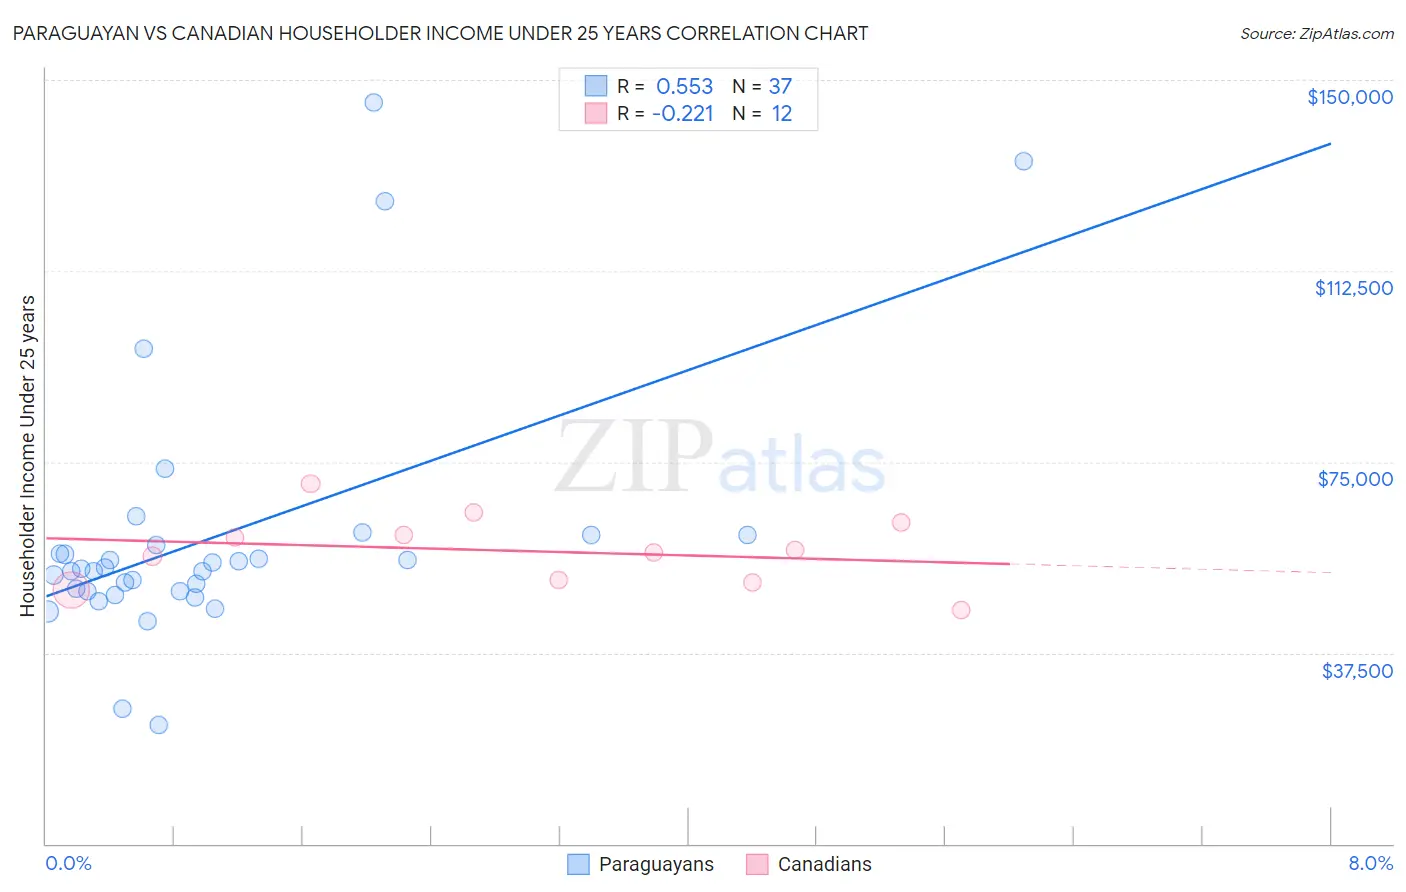
Paraguayan vs Canadian Householder Income Under 25 years Correlation Chart
The statistical analysis conducted on geographies consisting of 88,924,769 people shows a substantial positive correlation between the proportion of Paraguayans and household income with householder under the age of 25 in the United States with a correlation coefficient (R) of 0.553 and weighted average of $55,614. Similarly, the statistical analysis conducted on geographies consisting of 362,146,468 people shows a weak negative correlation between the proportion of Canadians and household income with householder under the age of 25 in the United States with a correlation coefficient (R) of -0.221 and weighted average of $52,336, a difference of 6.3%.
Householder Income Under 25 years Correlation Summary
| Measurement | Paraguayan | Canadian |
| Minimum | $23,438 | $45,833 |
| Maximum | $145,536 | $70,623 |
| Range | $122,098 | $24,790 |
| Mean | $60,245 | $57,498 |
| Median | $54,059 | $57,522 |
| Interquartile 25% (IQ1) | $49,601 | $51,515 |
| Interquartile 75% (IQ3) | $59,594 | $61,958 |
| Interquartile Range (IQR) | $9,992 | $10,443 |
| Standard Deviation (Sample) | $25,388 | $7,030 |
| Standard Deviation (Population) | $25,042 | $6,730 |
Similar Demographics by Householder Income Under 25 years
Demographics Similar to Paraguayans by Householder Income Under 25 years
In terms of householder income under 25 years, the demographic groups most similar to Paraguayans are Spanish American Indian ($55,573, a difference of 0.070%), Immigrants from Eastern Europe ($55,572, a difference of 0.070%), Cambodian ($55,571, a difference of 0.080%), Immigrants from Vietnam ($55,562, a difference of 0.090%), and Iranian ($55,548, a difference of 0.12%).
| Demographics | Rating | Rank | Householder Income Under 25 years |
| Immigrants | Russia | 100.0 /100 | #37 | Exceptional $55,891 |
| Immigrants | Iran | 100.0 /100 | #38 | Exceptional $55,880 |
| Immigrants | Belarus | 100.0 /100 | #39 | Exceptional $55,743 |
| Immigrants | Greece | 100.0 /100 | #40 | Exceptional $55,727 |
| Immigrants | Guyana | 100.0 /100 | #41 | Exceptional $55,726 |
| Immigrants | Korea | 100.0 /100 | #42 | Exceptional $55,716 |
| Immigrants | South Eastern Asia | 100.0 /100 | #43 | Exceptional $55,714 |
| Paraguayans | 100.0 /100 | #44 | Exceptional $55,614 |
| Spanish American Indians | 100.0 /100 | #45 | Exceptional $55,573 |
| Immigrants | Eastern Europe | 100.0 /100 | #46 | Exceptional $55,572 |
| Cambodians | 100.0 /100 | #47 | Exceptional $55,571 |
| Immigrants | Vietnam | 100.0 /100 | #48 | Exceptional $55,562 |
| Iranians | 100.0 /100 | #49 | Exceptional $55,548 |
| Puget Sound Salish | 100.0 /100 | #50 | Exceptional $55,543 |
| Immigrants | Romania | 100.0 /100 | #51 | Exceptional $55,522 |
Demographics Similar to Canadians by Householder Income Under 25 years
In terms of householder income under 25 years, the demographic groups most similar to Canadians are Israeli ($52,335, a difference of 0.0%), Japanese ($52,365, a difference of 0.060%), Immigrants from Uganda ($52,374, a difference of 0.070%), Immigrants from Uruguay ($52,302, a difference of 0.070%), and Immigrants from Austria ($52,400, a difference of 0.12%).
| Demographics | Rating | Rank | Householder Income Under 25 years |
| Immigrants | Cambodia | 65.4 /100 | #162 | Good $52,450 |
| Immigrants | Chile | 64.8 /100 | #163 | Good $52,440 |
| Immigrants | Trinidad and Tobago | 64.7 /100 | #164 | Good $52,437 |
| Poles | 63.0 /100 | #165 | Good $52,407 |
| Immigrants | Austria | 62.6 /100 | #166 | Good $52,400 |
| Immigrants | Uganda | 61.1 /100 | #167 | Good $52,374 |
| Japanese | 60.5 /100 | #168 | Good $52,365 |
| Canadians | 58.8 /100 | #169 | Average $52,336 |
| Israelis | 58.8 /100 | #170 | Average $52,335 |
| Immigrants | Uruguay | 56.8 /100 | #171 | Average $52,302 |
| Cypriots | 51.2 /100 | #172 | Average $52,209 |
| Barbadians | 50.8 /100 | #173 | Average $52,202 |
| Immigrants | Western Asia | 50.0 /100 | #174 | Average $52,190 |
| Immigrants | Zimbabwe | 33.8 /100 | #175 | Fair $51,914 |
| Austrians | 32.9 /100 | #176 | Fair $51,898 |