Panamanian vs Inupiat Householder Income Ages 45 - 64 years

COMPARE

Panamanian
Race
Ancestry
AfghanAfricanAlaska NativeAlaskan AthabascanAlbanianAleutAlsatianAmericanApacheArabArapahoArgentineanArmenianAssyrian/Chaldean/SyriacAustralianAustrianBahamianBangladeshiBarbadianBasqueBelgianBelizeanBermudanBhutaneseBlackfeetBolivianBrazilianBritishBritish West IndianBulgarianBurmeseCajunCambodianCanadianCape VerdeanCarpatho RusynCelticCentral AmericanCentral American IndianCherokeeCheyenneChickasawChileanChineseChippewaChoctawColombianColvilleComancheCosta RicanCreeCreekCroatianCrowCubanCypriotCzechCzechoslovakianDanishDelawareDominicanDutchDutch West IndianEastern EuropeanEcuadorianEgyptianEnglishEstonianEthiopianEuropeanFijianFilipinoFinnishFrenchFrench American IndianFrench CanadianGermanGerman RussianGhanaianGreekGuamanian/ChamorroGuatemalanGuyaneseHaitianHmongHonduranHopiHoumaHungarianIcelanderIndian (Asian)IndonesianIranianIraqiIrishIroquoisIsraeliItalianJamaicanJapaneseJordanianKenyanKiowaKoreanLaotianLatvianLebaneseLiberianLithuanianLumbeeLuxembourgerMacedonianMalaysianMalteseMarshalleseMenomineeMexicanMexican American IndianMongolianMoroccanNative HawaiianNavajoNepaleseNew ZealanderNicaraguanNigerianNorthern EuropeanNorwegianOkinawanOsageOttawaPaiutePakistaniPalestinianPanamanianParaguayanPennsylvania GermanPeruvianPimaPolishPortuguesePotawatomiPuebloPuerto RicanPuget Sound SalishRomanianRussianSalvadoranSamoanScandinavianScotch-IrishScottishSeminoleSenegaleseSerbianShoshoneSierra LeoneanSiouxSlavicSlovakSloveneSomaliSouth AfricanSouth AmericanSouth American IndianSoviet UnionSpaniardSpanishSpanish AmericanSpanish American IndianSri LankanSubsaharan AfricanSudaneseSwedishSwissSyrianTaiwaneseThaiTlingit-HaidaTohono O'OdhamTonganTrinidadian and TobagonianTsimshianTurkishU.S. Virgin IslanderUgandanUkrainianUruguayanUteVenezuelanVietnameseWelshWest IndianYakamaYaquiYugoslavianYumanYup'ikZimbabwean
Immigration
NonimmigrantsImmigrantsAfghanistanAfricaAlbaniaArgentinaArmeniaAsiaAustraliaAustriaBahamasBangladeshBarbadosBelarusBelgiumBelizeBoliviaBosnia and HerzegovinaBrazilBulgariaBurma/MyanmarCabo VerdeCambodiaCameroonCanadaCaribbeanCentral AmericaChileChinaColombiaCongoCosta RicaCroatiaCubaCzechoslovakiaDenmarkDominicaDominican RepublicEastern AfricaEastern AsiaEastern EuropeEcuadorEgyptEl SalvadorEnglandEritreaEthiopiaEuropeFijiFranceGermanyGhanaGreeceGrenadaGuatemalaGuyanaHaitiHondurasHong KongHungaryIndiaIndonesiaIranIraqIrelandIsraelItalyJamaicaJapanJordanKazakhstanKenyaKoreaKuwaitLaosLatin AmericaLatviaLebanonLiberiaLithuaniaMalaysiaMexicoMicronesiaMiddle AfricaMoldovaMoroccoNepalNetherlandsNicaraguaNigeriaNorth AmericaNorth MacedoniaNorthern AfricaNorthern EuropeNorwayOceaniaPakistanPanamaPeruPhilippinesPolandPortugalRomaniaRussiaSaudi ArabiaScotlandSenegalSerbiaSierra LeoneSingaporeSomaliaSouth AfricaSouth AmericaSouth Central AsiaSouth Eastern AsiaSouthern EuropeSpainSri LankaSt. Vincent and the GrenadinesSudanSwedenSwitzerlandSyriaTaiwanThailandTrinidad and TobagoTurkeyUgandaUkraineUruguayUzbekistanVenezuelaVietnamWest IndiesWestern AfricaWestern AsiaWestern EuropeYemenZaireZimbabweAzores
Inupiat
Race
Ancestry
AfghanAfricanAlaska NativeAlaskan AthabascanAlbanianAleutAlsatianAmericanApacheArabArapahoArgentineanArmenianAssyrian/Chaldean/SyriacAustralianAustrianBahamianBangladeshiBarbadianBasqueBelgianBelizeanBermudanBhutaneseBlackfeetBolivianBrazilianBritishBritish West IndianBulgarianBurmeseCajunCambodianCanadianCape VerdeanCarpatho RusynCelticCentral AmericanCentral American IndianCherokeeCheyenneChickasawChileanChineseChippewaChoctawColombianColvilleComancheCosta RicanCreeCreekCroatianCrowCubanCypriotCzechCzechoslovakianDanishDelawareDominicanDutchDutch West IndianEastern EuropeanEcuadorianEgyptianEnglishEstonianEthiopianEuropeanFijianFilipinoFinnishFrenchFrench American IndianFrench CanadianGermanGerman RussianGhanaianGreekGuamanian/ChamorroGuatemalanGuyaneseHaitianHmongHonduranHopiHoumaHungarianIcelanderIndian (Asian)IndonesianInupiatIranianIraqiIrishIroquoisIsraeliItalianJamaicanJapaneseJordanianKenyanKiowaKoreanLaotianLatvianLebaneseLiberianLithuanianLumbeeLuxembourgerMacedonianMalaysianMalteseMarshalleseMenomineeMexicanMexican American IndianMongolianMoroccanNative HawaiianNavajoNepaleseNew ZealanderNicaraguanNigerianNorthern EuropeanNorwegianOkinawanOsageOttawaPaiutePakistaniPalestinianParaguayanPennsylvania GermanPeruvianPimaPolishPortuguesePotawatomiPuebloPuerto RicanPuget Sound SalishRomanianRussianSalvadoranSamoanScandinavianScotch-IrishScottishSeminoleSenegaleseSerbianShoshoneSierra LeoneanSiouxSlavicSlovakSloveneSomaliSouth AfricanSouth AmericanSouth American IndianSoviet UnionSpaniardSpanishSpanish AmericanSpanish American IndianSri LankanSubsaharan AfricanSudaneseSwedishSwissSyrianTaiwaneseThaiTlingit-HaidaTohono O'OdhamTonganTrinidadian and TobagonianTsimshianTurkishU.S. Virgin IslanderUgandanUkrainianUruguayanUteVenezuelanVietnameseWelshWest IndianYakamaYaquiYugoslavianYumanYup'ikZimbabwean
Immigration
NonimmigrantsImmigrantsAfghanistanAfricaAlbaniaArgentinaArmeniaAsiaAustraliaAustriaBahamasBangladeshBarbadosBelarusBelgiumBelizeBoliviaBosnia and HerzegovinaBrazilBulgariaBurma/MyanmarCabo VerdeCambodiaCameroonCanadaCaribbeanCentral AmericaChileChinaColombiaCongoCosta RicaCroatiaCubaCzechoslovakiaDenmarkDominicaDominican RepublicEastern AfricaEastern AsiaEastern EuropeEcuadorEgyptEl SalvadorEnglandEritreaEthiopiaEuropeFijiFranceGermanyGhanaGreeceGrenadaGuatemalaGuyanaHaitiHondurasHong KongHungaryIndiaIndonesiaIranIraqIrelandIsraelItalyJamaicaJapanJordanKazakhstanKenyaKoreaKuwaitLaosLatin AmericaLatviaLebanonLiberiaLithuaniaMalaysiaMexicoMicronesiaMiddle AfricaMoldovaMoroccoNepalNetherlandsNicaraguaNigeriaNorth AmericaNorth MacedoniaNorthern AfricaNorthern EuropeNorwayOceaniaPakistanPanamaPeruPhilippinesPolandPortugalRomaniaRussiaSaudi ArabiaScotlandSenegalSerbiaSierra LeoneSingaporeSomaliaSouth AfricaSouth AmericaSouth Central AsiaSouth Eastern AsiaSouthern EuropeSpainSri LankaSt. Vincent and the GrenadinesSudanSwedenSwitzerlandSyriaTaiwanThailandTrinidad and TobagoTurkeyUgandaUkraineUruguayUzbekistanVenezuelaVietnamWest IndiesWestern AfricaWestern AsiaWestern EuropeYemenZaireZimbabweAzores
Householder Income Ages 45 - 64 years
Income
Poverty
Unemployment
Labor Participation
Family Structure
Vehicle Availability
Education Level
Disability

Householder Income Ages 45 - 64 years Comparison

Panamanians

Inupiat

Poor
Tragic
$96,066
HOUSEHOLDER INCOME AGES 45 - 64 YEARS
10.6/ 100
METRIC RATING
214th/ 347
METRIC RANK
$91,355
HOUSEHOLDER INCOME AGES 45 - 64 YEARS
1.1/ 100
METRIC RATING
242nd/ 347
METRIC RANK

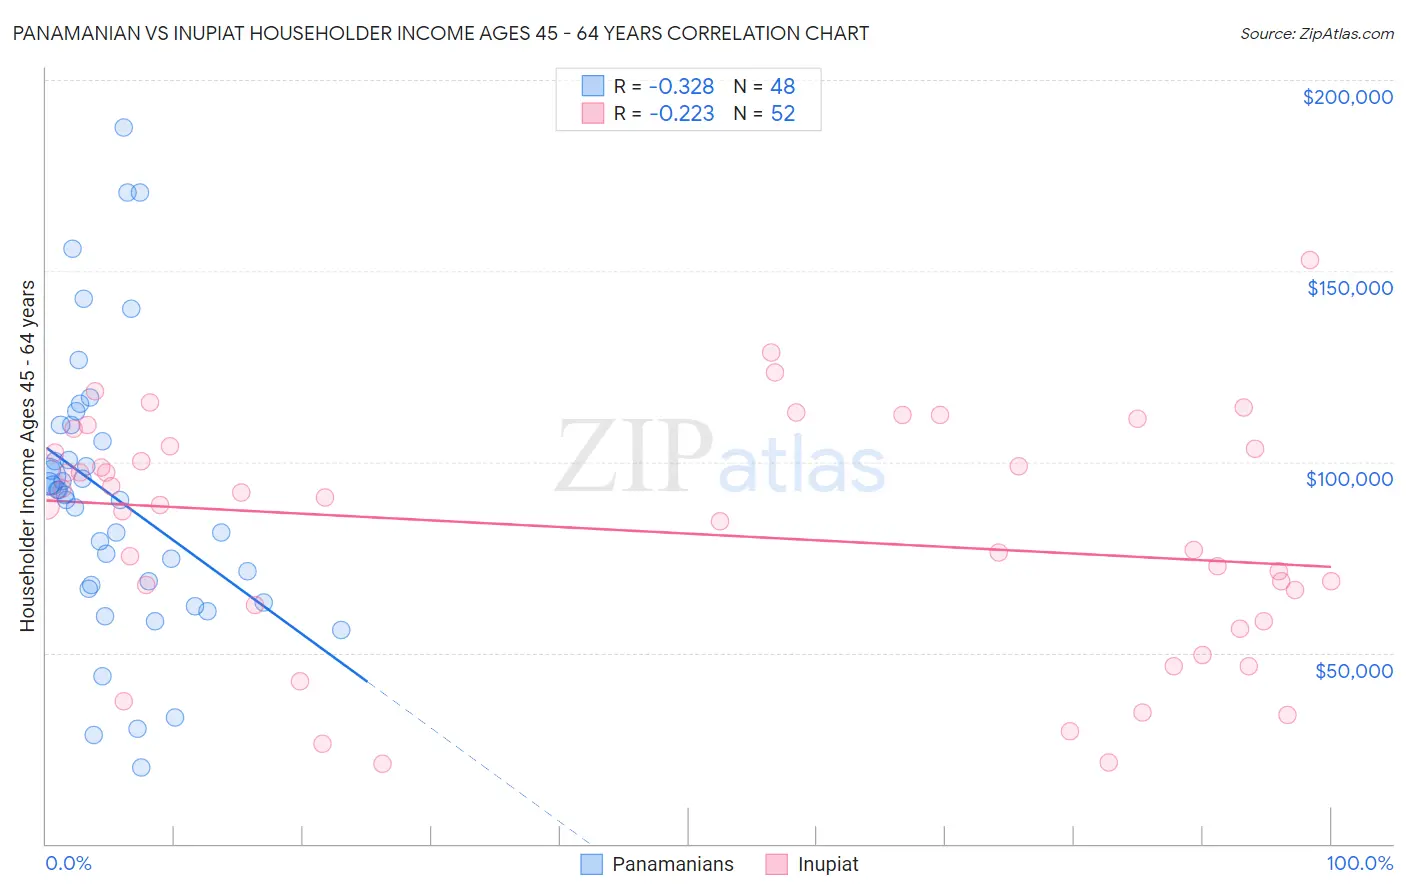
Panamanian vs Inupiat Householder Income Ages 45 - 64 years Correlation Chart

The statistical analysis conducted on geographies consisting of 280,831,012 people shows a mild negative correlation between the proportion of Panamanians and household income with householder between the ages 45 and 64 in the United States with a correlation coefficient (R) of -0.328 and weighted average of $96,066. Similarly, the statistical analysis conducted on geographies consisting of 96,273,732 people shows a weak negative correlation between the proportion of Inupiat and household income with householder between the ages 45 and 64 in the United States with a correlation coefficient (R) of -0.223 and weighted average of $91,355, a difference of 5.2%.
Panamanian vs Inupiat Householder Income Ages 45 - 64 years

Householder Income Ages 45 - 64 years Correlation Summary

MeasurementPanamanianInupiat
Minimum$19,813$20,833
Maximum$187,621$152,917
Range$167,808$132,084
Mean$90,923$81,669
Median$91,973$88,444
Interquartile 25% (IQ1)$67,292$60,416
Interquartile 75% (IQ3)$107,469$103,725
Interquartile Range (IQR)$40,176$43,309
Standard Deviation (Sample)$36,458$30,923
Standard Deviation (Population)$36,077$30,625

Similar Demographics by Householder Income Ages 45 - 64 years

Demographics Similar to Panamanians by Householder Income Ages 45 - 64 years

In terms of householder income ages 45 - 64 years, the demographic groups most similar to Panamanians are Immigrants from Uruguay ($96,086, a difference of 0.020%), Venezuelan ($96,460, a difference of 0.41%), Immigrants from Cambodia ($96,537, a difference of 0.49%), Nigerian ($95,492, a difference of 0.60%), and Tsimshian ($96,783, a difference of 0.75%).
DemographicsRating | RankHouseholder Income Ages 45 - 64 years
Ghanaians
17.9
/100
|
#207
Poor
$97,277
Scotch-Irish
16.4
/100
|
#208
Poor
$97,073
Japanese
14.8
/100
|
#209
Poor
$96,834
Tsimshian
14.5
/100
|
#210
Poor
$96,783
Immigrants | Cambodia
13.0
/100
|
#211
Poor
$96,537
Venezuelans
12.6
/100
|
#212
Poor
$96,460
Immigrants | Uruguay
10.7
/100
|
#213
Poor
$96,086
Panamanians
10.6
/100
|
#214
Poor
$96,066
Nigerians
8.2
/100
|
#215
Tragic
$95,492
Immigrants | Venezuela
7.6
/100
|
#216
Tragic
$95,342
Immigrants | Ghana
6.4
/100
|
#217
Tragic
$94,982
Delaware
6.2
/100
|
#218
Tragic
$94,914
Immigrants | Armenia
6.1
/100
|
#219
Tragic
$94,863
Salvadorans
6.0
/100
|
#220
Tragic
$94,842
Immigrants | Nigeria
5.9
/100
|
#221
Tragic
$94,804

Demographics Similar to Inupiat by Householder Income Ages 45 - 64 years

In terms of householder income ages 45 - 64 years, the demographic groups most similar to Inupiat are Trinidadian and Tobagonian ($91,357, a difference of 0.0%), Immigrants from Trinidad and Tobago ($91,347, a difference of 0.010%), Immigrants from Burma/Myanmar ($91,385, a difference of 0.030%), Immigrants from Middle Africa ($91,293, a difference of 0.070%), and Immigrants from Ecuador ($91,462, a difference of 0.12%).
DemographicsRating | RankHouseholder Income Ages 45 - 64 years
Nicaraguans
2.0
/100
|
#235
Tragic
$92,554
Immigrants | Western Africa
1.8
/100
|
#236
Tragic
$92,384
Immigrants | Bangladesh
1.7
/100
|
#237
Tragic
$92,208
Pennsylvania Germans
1.5
/100
|
#238
Tragic
$91,956
Immigrants | Ecuador
1.2
/100
|
#239
Tragic
$91,462
Immigrants | Burma/Myanmar
1.1
/100
|
#240
Tragic
$91,385
Trinidadians and Tobagonians
1.1
/100
|
#241
Tragic
$91,357
Inupiat
1.1
/100
|
#242
Tragic
$91,355
Immigrants | Trinidad and Tobago
1.1
/100
|
#243
Tragic
$91,347
Immigrants | Middle Africa
1.1
/100
|
#244
Tragic
$91,293
Guyanese
0.9
/100
|
#245
Tragic
$90,966
Central Americans
0.9
/100
|
#246
Tragic
$90,951
Alaskan Athabascans
0.9
/100
|
#247
Tragic
$90,951
Immigrants | Laos
0.9
/100
|
#248
Tragic
$90,909
Mexican American Indians
0.8
/100
|
#249
Tragic
$90,811