Panamanian vs Immigrants from Latin America Median Earnings
COMPARE
Panamanian
Immigrants from Latin America
Median Earnings
Median Earnings Comparison
Panamanians
Immigrants from Latin America
$45,593
MEDIAN EARNINGS
23.5/ 100
METRIC RATING
211th/ 347
METRIC RANK
$41,049
MEDIAN EARNINGS
0.1/ 100
METRIC RATING
301st/ 347
METRIC RANK
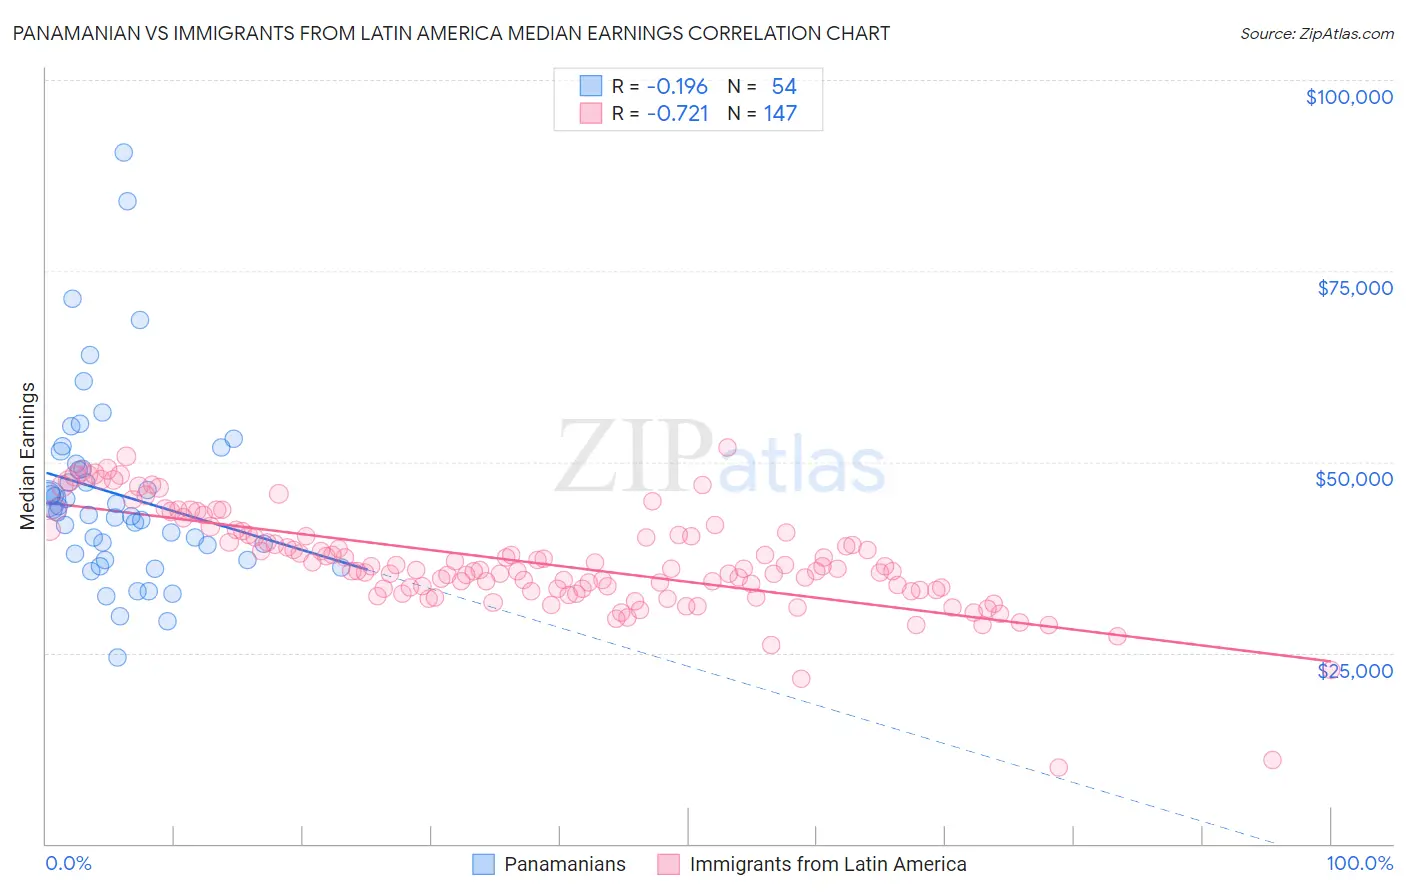
Panamanian vs Immigrants from Latin America Median Earnings Correlation Chart
The statistical analysis conducted on geographies consisting of 281,227,133 people shows a poor negative correlation between the proportion of Panamanians and median earnings in the United States with a correlation coefficient (R) of -0.196 and weighted average of $45,593. Similarly, the statistical analysis conducted on geographies consisting of 558,378,715 people shows a strong negative correlation between the proportion of Immigrants from Latin America and median earnings in the United States with a correlation coefficient (R) of -0.721 and weighted average of $41,049, a difference of 11.1%.
Median Earnings Correlation Summary
| Measurement | Panamanian | Immigrants from Latin America |
| Minimum | $24,420 | $9,917 |
| Maximum | $90,539 | $51,911 |
| Range | $66,119 | $41,994 |
| Mean | $45,745 | $36,860 |
| Median | $43,597 | $35,939 |
| Interquartile 25% (IQ1) | $37,947 | $33,290 |
| Interquartile 75% (IQ3) | $49,738 | $40,442 |
| Interquartile Range (IQR) | $11,791 | $7,152 |
| Standard Deviation (Sample) | $12,464 | $6,579 |
| Standard Deviation (Population) | $12,348 | $6,556 |
Similar Demographics by Median Earnings
Demographics Similar to Panamanians by Median Earnings
In terms of median earnings, the demographic groups most similar to Panamanians are Bermudan ($45,593, a difference of 0.0%), Immigrants from Bosnia and Herzegovina ($45,600, a difference of 0.010%), Immigrants from Thailand ($45,598, a difference of 0.010%), Immigrants from Grenada ($45,596, a difference of 0.010%), and Immigrants from Senegal ($45,611, a difference of 0.040%).
| Demographics | Rating | Rank | Median Earnings |
| Immigrants | Uruguay | 25.9 /100 | #204 | Fair $45,682 |
| Tongans | 25.4 /100 | #205 | Fair $45,665 |
| Immigrants | Ghana | 24.8 /100 | #206 | Fair $45,641 |
| Immigrants | Senegal | 24.0 /100 | #207 | Fair $45,611 |
| Immigrants | Bosnia and Herzegovina | 23.7 /100 | #208 | Fair $45,600 |
| Immigrants | Thailand | 23.7 /100 | #209 | Fair $45,598 |
| Immigrants | Grenada | 23.6 /100 | #210 | Fair $45,596 |
| Panamanians | 23.5 /100 | #211 | Fair $45,593 |
| Bermudans | 23.5 /100 | #212 | Fair $45,593 |
| Immigrants | Colombia | 22.4 /100 | #213 | Fair $45,550 |
| Nigerians | 22.0 /100 | #214 | Fair $45,532 |
| Immigrants | Bangladesh | 22.0 /100 | #215 | Fair $45,532 |
| Guyanese | 20.6 /100 | #216 | Fair $45,470 |
| Tlingit-Haida | 20.5 /100 | #217 | Fair $45,468 |
| Spanish | 19.7 /100 | #218 | Poor $45,432 |
Demographics Similar to Immigrants from Latin America by Median Earnings
In terms of median earnings, the demographic groups most similar to Immigrants from Latin America are Ute ($41,051, a difference of 0.010%), Immigrants from Caribbean ($41,119, a difference of 0.17%), Immigrants from Micronesia ($41,133, a difference of 0.20%), Shoshone ($40,932, a difference of 0.29%), and Haitian ($40,918, a difference of 0.32%).
| Demographics | Rating | Rank | Median Earnings |
| Potawatomi | 0.1 /100 | #294 | Tragic $41,288 |
| Bangladeshis | 0.1 /100 | #295 | Tragic $41,263 |
| Cherokee | 0.1 /100 | #296 | Tragic $41,252 |
| Guatemalans | 0.1 /100 | #297 | Tragic $41,205 |
| Immigrants | Micronesia | 0.1 /100 | #298 | Tragic $41,133 |
| Immigrants | Caribbean | 0.1 /100 | #299 | Tragic $41,119 |
| Ute | 0.1 /100 | #300 | Tragic $41,051 |
| Immigrants | Latin America | 0.1 /100 | #301 | Tragic $41,049 |
| Shoshone | 0.0 /100 | #302 | Tragic $40,932 |
| Haitians | 0.0 /100 | #303 | Tragic $40,918 |
| Immigrants | Guatemala | 0.0 /100 | #304 | Tragic $40,851 |
| Chickasaw | 0.0 /100 | #305 | Tragic $40,672 |
| Yaqui | 0.0 /100 | #306 | Tragic $40,647 |
| Hondurans | 0.0 /100 | #307 | Tragic $40,638 |
| Cubans | 0.0 /100 | #308 | Tragic $40,619 |