Panamanian vs Immigrants from Caribbean Median Household Income
COMPARE
Panamanian
Immigrants from Caribbean
Median Household Income
Median Household Income Comparison
Panamanians
Immigrants from Caribbean
$82,272
MEDIAN HOUSEHOLD INCOME
14.0/ 100
METRIC RATING
214th/ 347
METRIC RANK
$71,860
MEDIAN HOUSEHOLD INCOME
0.0/ 100
METRIC RATING
309th/ 347
METRIC RANK
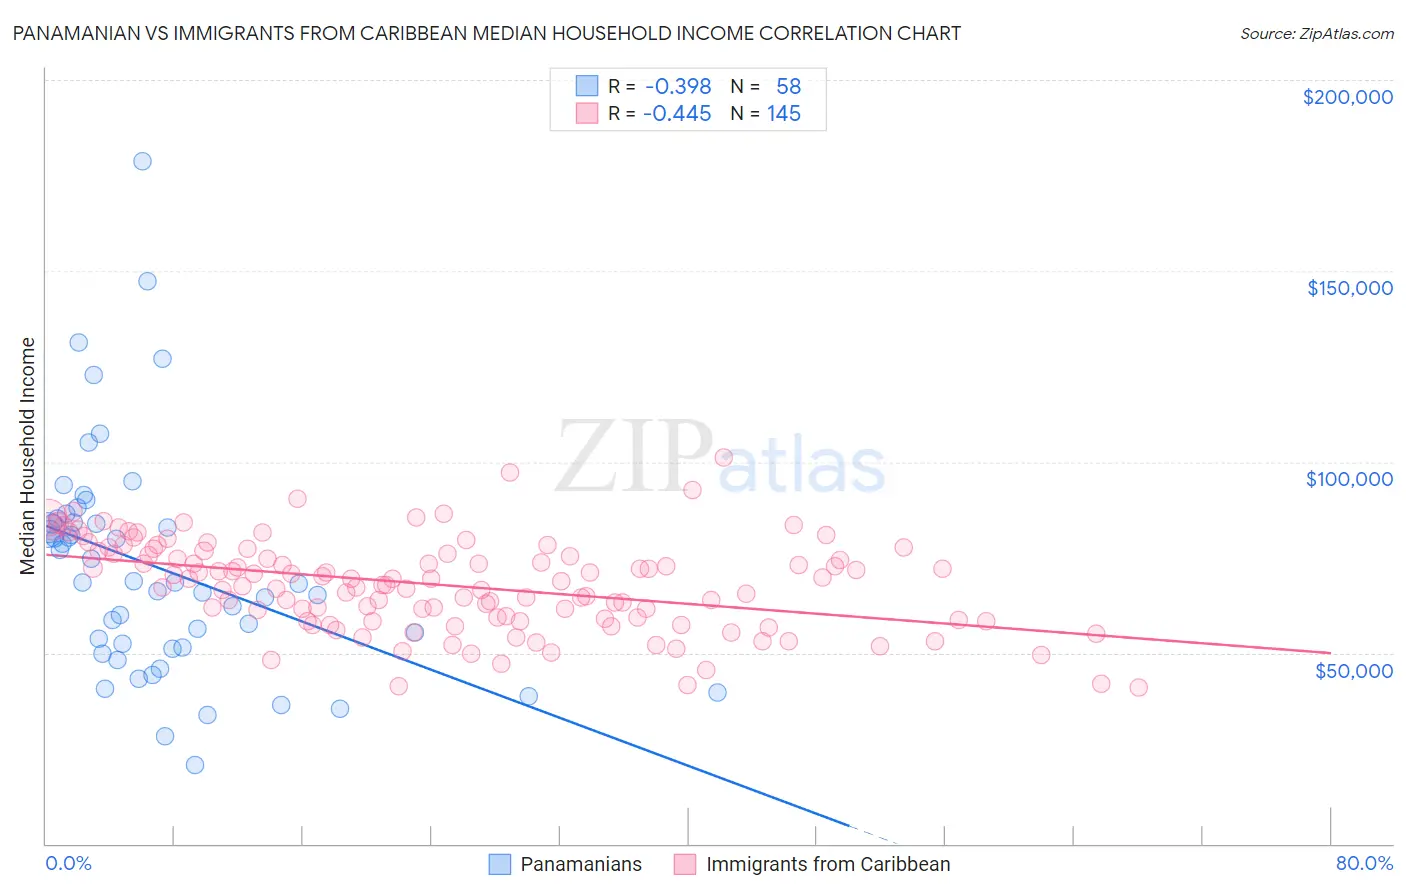
Panamanian vs Immigrants from Caribbean Median Household Income Correlation Chart
The statistical analysis conducted on geographies consisting of 281,034,556 people shows a mild negative correlation between the proportion of Panamanians and median household income in the United States with a correlation coefficient (R) of -0.398 and weighted average of $82,272. Similarly, the statistical analysis conducted on geographies consisting of 449,492,713 people shows a moderate negative correlation between the proportion of Immigrants from Caribbean and median household income in the United States with a correlation coefficient (R) of -0.445 and weighted average of $71,860, a difference of 14.5%.
Median Household Income Correlation Summary
| Measurement | Panamanian | Immigrants from Caribbean |
| Minimum | $20,556 | $41,053 |
| Maximum | $178,834 | $101,042 |
| Range | $158,278 | $59,989 |
| Mean | $72,362 | $67,787 |
| Median | $68,346 | $68,717 |
| Interquartile 25% (IQ1) | $51,530 | $58,750 |
| Interquartile 75% (IQ3) | $83,972 | $76,359 |
| Interquartile Range (IQR) | $32,442 | $17,609 |
| Standard Deviation (Sample) | $29,634 | $11,824 |
| Standard Deviation (Population) | $29,377 | $11,783 |
Similar Demographics by Median Household Income
Demographics Similar to Panamanians by Median Household Income
In terms of median household income, the demographic groups most similar to Panamanians are Vietnamese ($82,248, a difference of 0.030%), Yugoslavian ($82,186, a difference of 0.10%), Nepalese ($82,410, a difference of 0.17%), Venezuelan ($82,432, a difference of 0.20%), and Salvadoran ($82,449, a difference of 0.22%).
| Demographics | Rating | Rank | Median Household Income |
| Dutch | 20.3 /100 | #207 | Fair $82,971 |
| French Canadians | 18.7 /100 | #208 | Poor $82,810 |
| Immigrants | Iraq | 16.7 /100 | #209 | Poor $82,594 |
| Immigrants | Uruguay | 16.4 /100 | #210 | Poor $82,560 |
| Salvadorans | 15.4 /100 | #211 | Poor $82,449 |
| Venezuelans | 15.3 /100 | #212 | Poor $82,432 |
| Nepalese | 15.1 /100 | #213 | Poor $82,410 |
| Panamanians | 14.0 /100 | #214 | Poor $82,272 |
| Vietnamese | 13.8 /100 | #215 | Poor $82,248 |
| Yugoslavians | 13.3 /100 | #216 | Poor $82,186 |
| Ecuadorians | 12.5 /100 | #217 | Poor $82,070 |
| Whites/Caucasians | 12.2 /100 | #218 | Poor $82,029 |
| Nigerians | 10.3 /100 | #219 | Poor $81,725 |
| Immigrants | Venezuela | 9.0 /100 | #220 | Tragic $81,506 |
| Immigrants | Ghana | 9.0 /100 | #221 | Tragic $81,489 |
Demographics Similar to Immigrants from Caribbean by Median Household Income
In terms of median household income, the demographic groups most similar to Immigrants from Caribbean are U.S. Virgin Islander ($71,853, a difference of 0.010%), Immigrants from Zaire ($71,801, a difference of 0.080%), Yakama ($72,225, a difference of 0.51%), Immigrants from Honduras ($71,452, a difference of 0.57%), and Immigrants from Bahamas ($71,349, a difference of 0.72%).
| Demographics | Rating | Rank | Median Household Income |
| Shoshone | 0.0 /100 | #302 | Tragic $72,660 |
| Africans | 0.0 /100 | #303 | Tragic $72,650 |
| Immigrants | Haiti | 0.0 /100 | #304 | Tragic $72,599 |
| Hondurans | 0.0 /100 | #305 | Tragic $72,588 |
| Potawatomi | 0.0 /100 | #306 | Tragic $72,576 |
| Ute | 0.0 /100 | #307 | Tragic $72,402 |
| Yakama | 0.0 /100 | #308 | Tragic $72,225 |
| Immigrants | Caribbean | 0.0 /100 | #309 | Tragic $71,860 |
| U.S. Virgin Islanders | 0.0 /100 | #310 | Tragic $71,853 |
| Immigrants | Zaire | 0.0 /100 | #311 | Tragic $71,801 |
| Immigrants | Honduras | 0.0 /100 | #312 | Tragic $71,452 |
| Immigrants | Bahamas | 0.0 /100 | #313 | Tragic $71,349 |
| Dominicans | 0.0 /100 | #314 | Tragic $71,302 |
| Ottawa | 0.0 /100 | #315 | Tragic $70,984 |
| Apache | 0.0 /100 | #316 | Tragic $70,927 |