Palestinian vs Immigrants from Dominica Per Capita Income
COMPARE
Palestinian
Immigrants from Dominica
Per Capita Income
Per Capita Income Comparison
Palestinians
Immigrants from Dominica
$45,790
PER CAPITA INCOME
91.6/ 100
METRIC RATING
126th/ 347
METRIC RANK
$37,952
PER CAPITA INCOME
0.2/ 100
METRIC RATING
281st/ 347
METRIC RANK
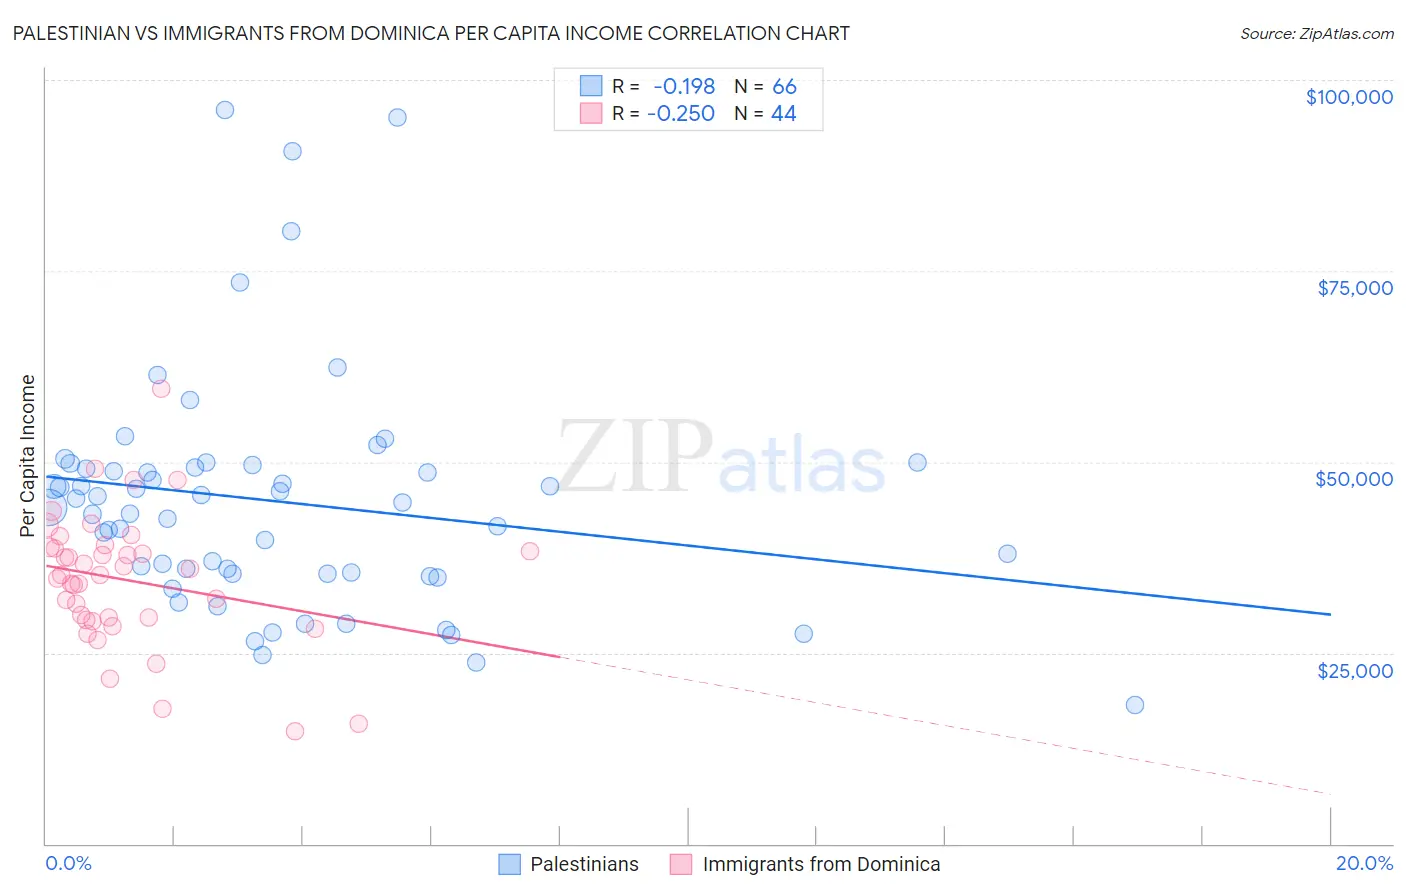
Palestinian vs Immigrants from Dominica Per Capita Income Correlation Chart
The statistical analysis conducted on geographies consisting of 216,465,639 people shows a poor negative correlation between the proportion of Palestinians and per capita income in the United States with a correlation coefficient (R) of -0.198 and weighted average of $45,790. Similarly, the statistical analysis conducted on geographies consisting of 83,794,667 people shows a weak negative correlation between the proportion of Immigrants from Dominica and per capita income in the United States with a correlation coefficient (R) of -0.250 and weighted average of $37,952, a difference of 20.6%.
Per Capita Income Correlation Summary
| Measurement | Palestinian | Immigrants from Dominica |
| Minimum | $18,117 | $14,729 |
| Maximum | $96,141 | $59,651 |
| Range | $78,024 | $44,922 |
| Mean | $44,786 | $34,508 |
| Median | $44,344 | $35,220 |
| Interquartile 25% (IQ1) | $35,413 | $29,494 |
| Interquartile 75% (IQ3) | $49,208 | $38,721 |
| Interquartile Range (IQR) | $13,795 | $9,227 |
| Standard Deviation (Sample) | $15,475 | $8,665 |
| Standard Deviation (Population) | $15,357 | $8,566 |
Similar Demographics by Per Capita Income
Demographics Similar to Palestinians by Per Capita Income
In terms of per capita income, the demographic groups most similar to Palestinians are Zimbabwean ($45,804, a difference of 0.030%), Immigrants from Germany ($45,751, a difference of 0.090%), Swedish ($45,750, a difference of 0.090%), European ($45,836, a difference of 0.10%), and Lebanese ($45,840, a difference of 0.11%).
| Demographics | Rating | Rank | Per Capita Income |
| Immigrants | Poland | 93.1 /100 | #119 | Exceptional $45,979 |
| Immigrants | Ethiopia | 92.7 /100 | #120 | Exceptional $45,923 |
| Canadians | 92.2 /100 | #121 | Exceptional $45,858 |
| Moroccans | 92.1 /100 | #122 | Exceptional $45,854 |
| Lebanese | 92.0 /100 | #123 | Exceptional $45,840 |
| Europeans | 92.0 /100 | #124 | Exceptional $45,836 |
| Zimbabweans | 91.7 /100 | #125 | Exceptional $45,804 |
| Palestinians | 91.6 /100 | #126 | Exceptional $45,790 |
| Immigrants | Germany | 91.3 /100 | #127 | Exceptional $45,751 |
| Swedes | 91.3 /100 | #128 | Exceptional $45,750 |
| Luxembourgers | 90.4 /100 | #129 | Exceptional $45,663 |
| Arabs | 90.4 /100 | #130 | Exceptional $45,662 |
| Immigrants | North Macedonia | 90.0 /100 | #131 | Exceptional $45,622 |
| Jordanians | 89.9 /100 | #132 | Excellent $45,605 |
| Pakistanis | 89.7 /100 | #133 | Excellent $45,587 |
Demographics Similar to Immigrants from Dominica by Per Capita Income
In terms of per capita income, the demographic groups most similar to Immigrants from Dominica are Colville ($38,047, a difference of 0.25%), Potawatomi ($38,046, a difference of 0.25%), Immigrants from Laos ($37,857, a difference of 0.25%), Pennsylvania German ($37,842, a difference of 0.29%), and Immigrants from Nicaragua ($38,065, a difference of 0.30%).
| Demographics | Rating | Rank | Per Capita Income |
| Immigrants | El Salvador | 0.3 /100 | #274 | Tragic $38,394 |
| Immigrants | Liberia | 0.2 /100 | #275 | Tragic $38,165 |
| Hmong | 0.2 /100 | #276 | Tragic $38,120 |
| Comanche | 0.2 /100 | #277 | Tragic $38,088 |
| Immigrants | Nicaragua | 0.2 /100 | #278 | Tragic $38,065 |
| Colville | 0.2 /100 | #279 | Tragic $38,047 |
| Potawatomi | 0.2 /100 | #280 | Tragic $38,046 |
| Immigrants | Dominica | 0.2 /100 | #281 | Tragic $37,952 |
| Immigrants | Laos | 0.1 /100 | #282 | Tragic $37,857 |
| Pennsylvania Germans | 0.1 /100 | #283 | Tragic $37,842 |
| Africans | 0.1 /100 | #284 | Tragic $37,785 |
| Guatemalans | 0.1 /100 | #285 | Tragic $37,766 |
| Central American Indians | 0.1 /100 | #286 | Tragic $37,699 |
| Dominicans | 0.1 /100 | #287 | Tragic $37,697 |
| Blackfeet | 0.1 /100 | #288 | Tragic $37,695 |