Palestinian vs Chilean Householder Income Ages 45 - 64 years
COMPARE
Palestinian
Chilean
Householder Income Ages 45 - 64 years
Householder Income Ages 45 - 64 years Comparison
Palestinians
Chileans
$107,721
HOUSEHOLDER INCOME AGES 45 - 64 YEARS
97.6/ 100
METRIC RATING
99th/ 347
METRIC RANK
$106,611
HOUSEHOLDER INCOME AGES 45 - 64 YEARS
95.9/ 100
METRIC RATING
109th/ 347
METRIC RANK
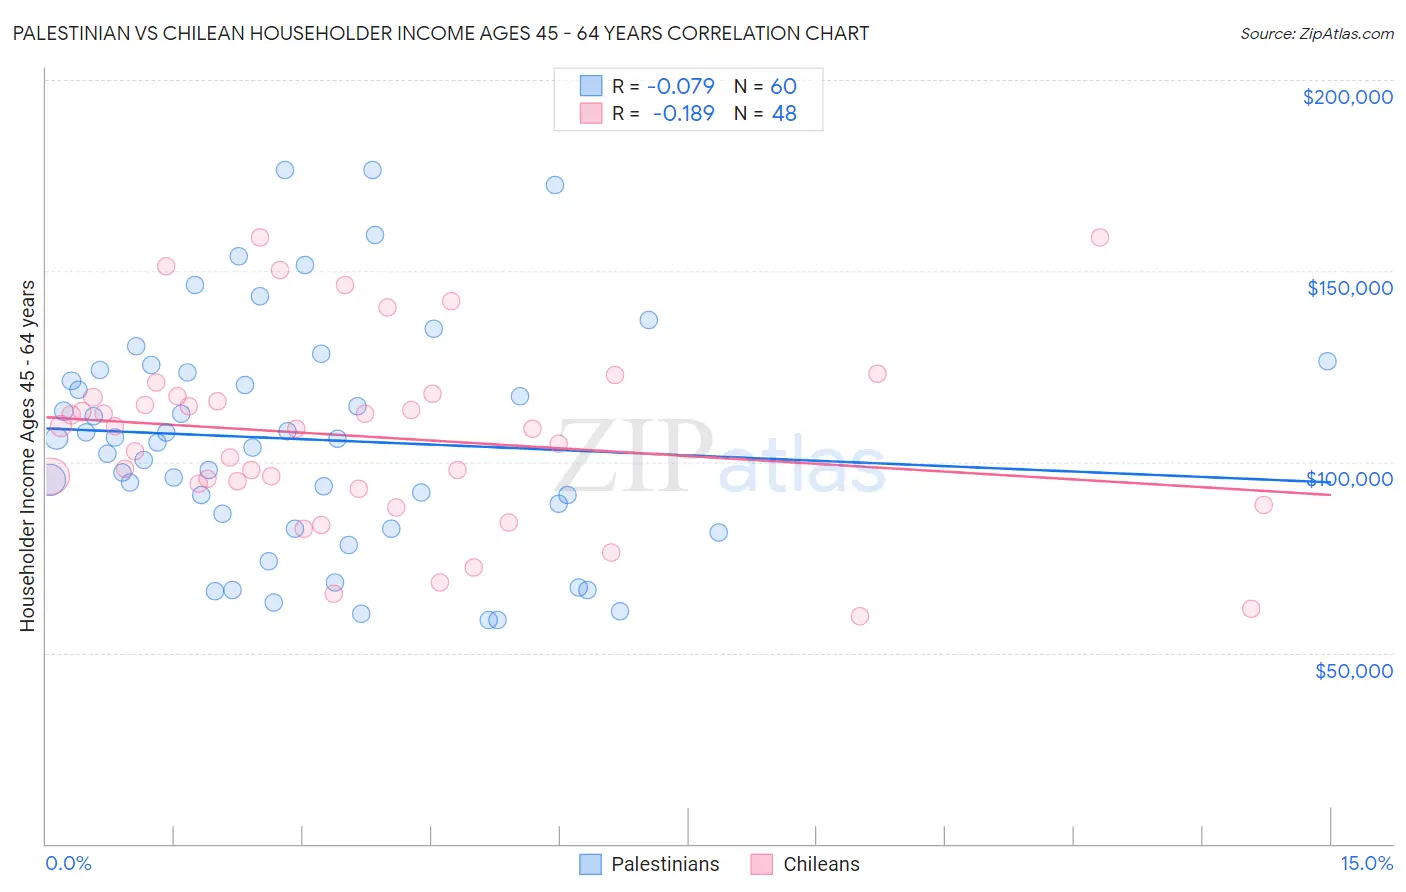
Palestinian vs Chilean Householder Income Ages 45 - 64 years Correlation Chart
The statistical analysis conducted on geographies consisting of 216,304,002 people shows a slight negative correlation between the proportion of Palestinians and household income with householder between the ages 45 and 64 in the United States with a correlation coefficient (R) of -0.079 and weighted average of $107,721. Similarly, the statistical analysis conducted on geographies consisting of 256,404,590 people shows a poor negative correlation between the proportion of Chileans and household income with householder between the ages 45 and 64 in the United States with a correlation coefficient (R) of -0.189 and weighted average of $106,611, a difference of 1.0%.
Householder Income Ages 45 - 64 years Correlation Summary
| Measurement | Palestinian | Chilean |
| Minimum | $58,671 | $59,712 |
| Maximum | $176,545 | $158,750 |
| Range | $117,874 | $99,038 |
| Mean | $105,880 | $106,575 |
| Median | $105,547 | $108,628 |
| Interquartile 25% (IQ1) | $84,446 | $93,623 |
| Interquartile 75% (IQ3) | $123,759 | $117,063 |
| Interquartile Range (IQR) | $39,313 | $23,441 |
| Standard Deviation (Sample) | $30,088 | $24,255 |
| Standard Deviation (Population) | $29,836 | $24,001 |
Demographics Similar to Palestinians and Chileans by Householder Income Ages 45 - 64 years
In terms of householder income ages 45 - 64 years, the demographic groups most similar to Palestinians are Immigrants from Southern Europe ($107,775, a difference of 0.050%), Northern European ($107,870, a difference of 0.14%), Immigrants from Serbia ($107,569, a difference of 0.14%), Immigrants from Kazakhstan ($107,378, a difference of 0.32%), and Immigrants from Moldova ($107,357, a difference of 0.34%). Similarly, the demographic groups most similar to Chileans are Immigrants from Brazil ($106,470, a difference of 0.13%), Immigrants from Vietnam ($106,417, a difference of 0.18%), Zimbabwean ($106,849, a difference of 0.22%), Swedish ($106,377, a difference of 0.22%), and European ($106,367, a difference of 0.23%).
| Demographics | Rating | Rank | Householder Income Ages 45 - 64 years |
| Sri Lankans | 98.2 /100 | #94 | Exceptional $108,270 |
| Immigrants | Hungary | 98.2 /100 | #95 | Exceptional $108,267 |
| Immigrants | Argentina | 98.2 /100 | #96 | Exceptional $108,264 |
| Northern Europeans | 97.8 /100 | #97 | Exceptional $107,870 |
| Immigrants | Southern Europe | 97.7 /100 | #98 | Exceptional $107,775 |
| Palestinians | 97.6 /100 | #99 | Exceptional $107,721 |
| Immigrants | Serbia | 97.4 /100 | #100 | Exceptional $107,569 |
| Immigrants | Kazakhstan | 97.2 /100 | #101 | Exceptional $107,378 |
| Immigrants | Moldova | 97.1 /100 | #102 | Exceptional $107,357 |
| Syrians | 96.9 /100 | #103 | Exceptional $107,207 |
| Immigrants | Ukraine | 96.7 /100 | #104 | Exceptional $107,079 |
| Macedonians | 96.7 /100 | #105 | Exceptional $107,074 |
| Armenians | 96.6 /100 | #106 | Exceptional $107,002 |
| Immigrants | Fiji | 96.5 /100 | #107 | Exceptional $106,952 |
| Zimbabweans | 96.3 /100 | #108 | Exceptional $106,849 |
| Chileans | 95.9 /100 | #109 | Exceptional $106,611 |
| Immigrants | Brazil | 95.6 /100 | #110 | Exceptional $106,470 |
| Immigrants | Vietnam | 95.5 /100 | #111 | Exceptional $106,417 |
| Swedes | 95.4 /100 | #112 | Exceptional $106,377 |
| Europeans | 95.4 /100 | #113 | Exceptional $106,367 |
| Immigrants | Poland | 95.3 /100 | #114 | Exceptional $106,319 |