Pakistani vs Immigrants from Congo Householder Income Ages 45 - 64 years
COMPARE
Pakistani
Immigrants from Congo
Householder Income Ages 45 - 64 years
Householder Income Ages 45 - 64 years Comparison
Pakistanis
Immigrants from Congo
$105,317
HOUSEHOLDER INCOME AGES 45 - 64 YEARS
92.4/ 100
METRIC RATING
125th/ 347
METRIC RANK
$77,850
HOUSEHOLDER INCOME AGES 45 - 64 YEARS
0.0/ 100
METRIC RATING
333rd/ 347
METRIC RANK
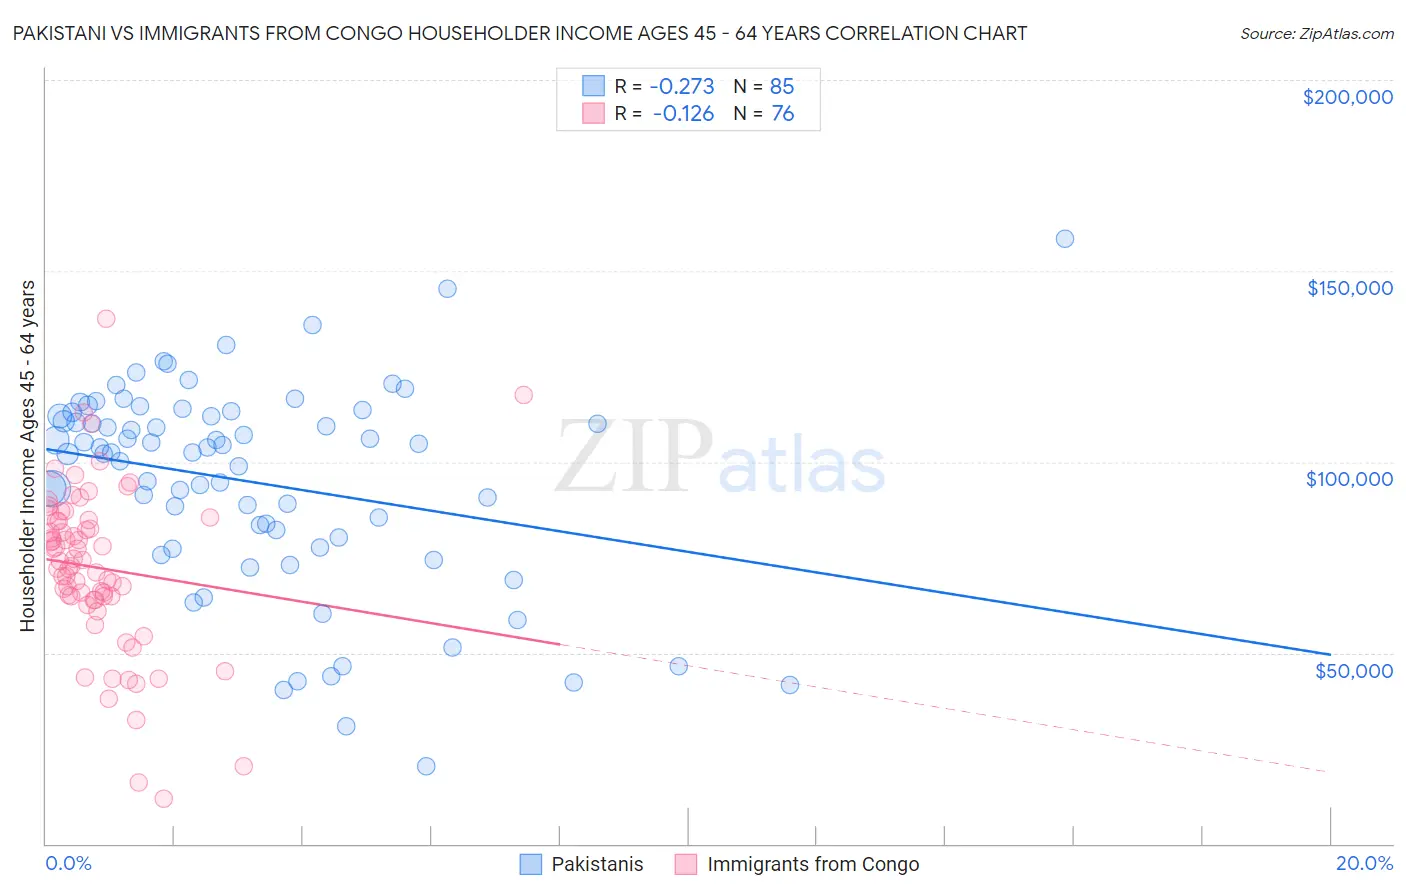
Pakistani vs Immigrants from Congo Householder Income Ages 45 - 64 years Correlation Chart
The statistical analysis conducted on geographies consisting of 334,898,404 people shows a weak negative correlation between the proportion of Pakistanis and household income with householder between the ages 45 and 64 in the United States with a correlation coefficient (R) of -0.273 and weighted average of $105,317. Similarly, the statistical analysis conducted on geographies consisting of 92,054,371 people shows a poor negative correlation between the proportion of Immigrants from Congo and household income with householder between the ages 45 and 64 in the United States with a correlation coefficient (R) of -0.126 and weighted average of $77,850, a difference of 35.3%.
Householder Income Ages 45 - 64 years Correlation Summary
| Measurement | Pakistani | Immigrants from Congo |
| Minimum | $20,167 | $11,745 |
| Maximum | $158,417 | $137,368 |
| Range | $138,250 | $125,623 |
| Mean | $94,559 | $72,239 |
| Median | $102,574 | $73,295 |
| Interquartile 25% (IQ1) | $78,855 | $64,310 |
| Interquartile 75% (IQ3) | $112,512 | $84,654 |
| Interquartile Range (IQR) | $33,657 | $20,344 |
| Standard Deviation (Sample) | $26,997 | $21,800 |
| Standard Deviation (Population) | $26,838 | $21,656 |
Similar Demographics by Householder Income Ages 45 - 64 years
Demographics Similar to Pakistanis by Householder Income Ages 45 - 64 years
In terms of householder income ages 45 - 64 years, the demographic groups most similar to Pakistanis are Portuguese ($105,309, a difference of 0.010%), Immigrants from Saudi Arabia ($105,249, a difference of 0.060%), Immigrants from Northern Africa ($105,430, a difference of 0.11%), Native Hawaiian ($105,149, a difference of 0.16%), and Peruvian ($105,070, a difference of 0.23%).
| Demographics | Rating | Rank | Householder Income Ages 45 - 64 years |
| Immigrants | Western Asia | 95.0 /100 | #118 | Exceptional $106,217 |
| Immigrants | Jordan | 94.9 /100 | #119 | Exceptional $106,164 |
| Immigrants | South Eastern Asia | 94.8 /100 | #120 | Exceptional $106,109 |
| Poles | 94.4 /100 | #121 | Exceptional $105,952 |
| Immigrants | North Macedonia | 94.2 /100 | #122 | Exceptional $105,892 |
| Danes | 93.4 /100 | #123 | Exceptional $105,619 |
| Immigrants | Northern Africa | 92.8 /100 | #124 | Exceptional $105,430 |
| Pakistanis | 92.4 /100 | #125 | Exceptional $105,317 |
| Portuguese | 92.4 /100 | #126 | Exceptional $105,309 |
| Immigrants | Saudi Arabia | 92.2 /100 | #127 | Exceptional $105,249 |
| Native Hawaiians | 91.8 /100 | #128 | Exceptional $105,149 |
| Peruvians | 91.5 /100 | #129 | Exceptional $105,070 |
| Immigrants | Zimbabwe | 91.2 /100 | #130 | Exceptional $104,992 |
| Immigrants | Syria | 90.7 /100 | #131 | Exceptional $104,858 |
| Lebanese | 90.1 /100 | #132 | Exceptional $104,734 |
Demographics Similar to Immigrants from Congo by Householder Income Ages 45 - 64 years
In terms of householder income ages 45 - 64 years, the demographic groups most similar to Immigrants from Congo are Black/African American ($78,556, a difference of 0.91%), Menominee ($76,903, a difference of 1.2%), Immigrants from Dominican Republic ($78,836, a difference of 1.3%), Creek ($78,960, a difference of 1.4%), and Dutch West Indian ($79,171, a difference of 1.7%).
| Demographics | Rating | Rank | Householder Income Ages 45 - 64 years |
| Dominicans | 0.0 /100 | #326 | Tragic $80,623 |
| Seminole | 0.0 /100 | #327 | Tragic $80,077 |
| Natives/Alaskans | 0.0 /100 | #328 | Tragic $79,816 |
| Dutch West Indians | 0.0 /100 | #329 | Tragic $79,171 |
| Creek | 0.0 /100 | #330 | Tragic $78,960 |
| Immigrants | Dominican Republic | 0.0 /100 | #331 | Tragic $78,836 |
| Blacks/African Americans | 0.0 /100 | #332 | Tragic $78,556 |
| Immigrants | Congo | 0.0 /100 | #333 | Tragic $77,850 |
| Menominee | 0.0 /100 | #334 | Tragic $76,903 |
| Cheyenne | 0.0 /100 | #335 | Tragic $76,362 |
| Arapaho | 0.0 /100 | #336 | Tragic $75,945 |
| Pueblo | 0.0 /100 | #337 | Tragic $75,601 |
| Hopi | 0.0 /100 | #338 | Tragic $75,562 |
| Kiowa | 0.0 /100 | #339 | Tragic $74,815 |
| Immigrants | Yemen | 0.0 /100 | #340 | Tragic $74,575 |