Paiute vs Sierra Leonean Median Household Income
COMPARE
Paiute
Sierra Leonean
Median Household Income
Median Household Income Comparison
Paiute
Sierra Leoneans
$72,959
MEDIAN HOUSEHOLD INCOME
0.0/ 100
METRIC RATING
298th/ 347
METRIC RANK
$88,463
MEDIAN HOUSEHOLD INCOME
89.6/ 100
METRIC RATING
137th/ 347
METRIC RANK
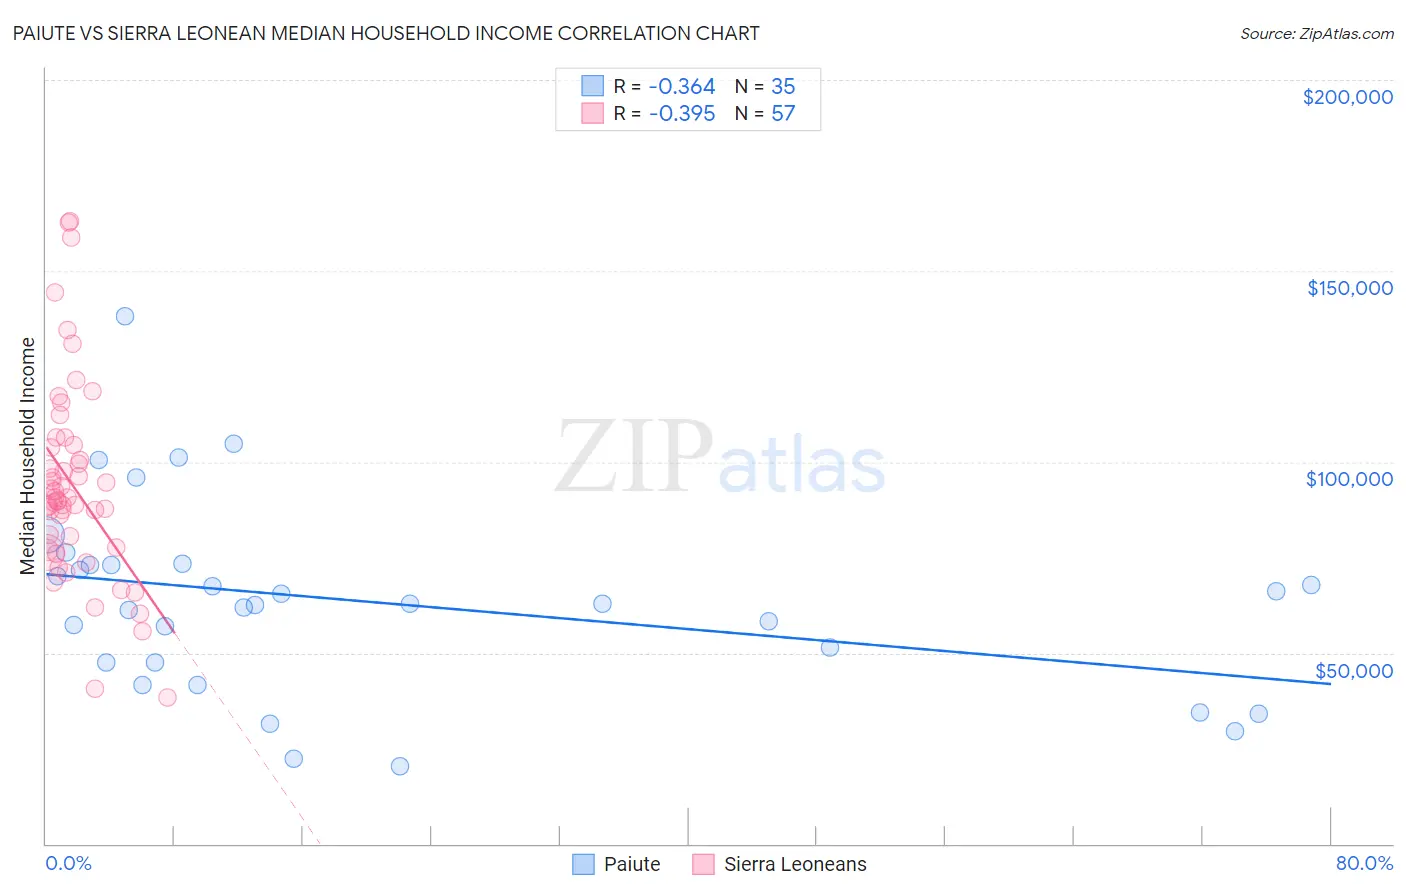
Paiute vs Sierra Leonean Median Household Income Correlation Chart
The statistical analysis conducted on geographies consisting of 58,395,139 people shows a mild negative correlation between the proportion of Paiute and median household income in the United States with a correlation coefficient (R) of -0.364 and weighted average of $72,959. Similarly, the statistical analysis conducted on geographies consisting of 83,336,605 people shows a mild negative correlation between the proportion of Sierra Leoneans and median household income in the United States with a correlation coefficient (R) of -0.395 and weighted average of $88,463, a difference of 21.2%.
Median Household Income Correlation Summary
| Measurement | Paiute | Sierra Leonean |
| Minimum | $20,139 | $38,207 |
| Maximum | $138,043 | $162,895 |
| Range | $117,904 | $124,688 |
| Mean | $63,163 | $93,657 |
| Median | $62,760 | $89,856 |
| Interquartile 25% (IQ1) | $47,361 | $77,308 |
| Interquartile 75% (IQ3) | $73,101 | $103,980 |
| Interquartile Range (IQR) | $25,740 | $26,672 |
| Standard Deviation (Sample) | $24,968 | $25,946 |
| Standard Deviation (Population) | $24,608 | $25,718 |
Similar Demographics by Median Household Income
Demographics Similar to Paiute by Median Household Income
In terms of median household income, the demographic groups most similar to Paiute are Indonesian ($72,856, a difference of 0.14%), Immigrants from Mexico ($73,160, a difference of 0.27%), Immigrants from Dominica ($72,760, a difference of 0.27%), Cherokee ($72,682, a difference of 0.38%), and Shoshone ($72,660, a difference of 0.41%).
| Demographics | Rating | Rank | Median Household Income |
| Hispanics or Latinos | 0.1 /100 | #291 | Tragic $73,823 |
| Comanche | 0.1 /100 | #292 | Tragic $73,747 |
| Immigrants | Cabo Verde | 0.1 /100 | #293 | Tragic $73,515 |
| Blackfeet | 0.1 /100 | #294 | Tragic $73,509 |
| Cubans | 0.1 /100 | #295 | Tragic $73,392 |
| Haitians | 0.1 /100 | #296 | Tragic $73,306 |
| Immigrants | Mexico | 0.0 /100 | #297 | Tragic $73,160 |
| Paiute | 0.0 /100 | #298 | Tragic $72,959 |
| Indonesians | 0.0 /100 | #299 | Tragic $72,856 |
| Immigrants | Dominica | 0.0 /100 | #300 | Tragic $72,760 |
| Cherokee | 0.0 /100 | #301 | Tragic $72,682 |
| Shoshone | 0.0 /100 | #302 | Tragic $72,660 |
| Africans | 0.0 /100 | #303 | Tragic $72,650 |
| Immigrants | Haiti | 0.0 /100 | #304 | Tragic $72,599 |
| Hondurans | 0.0 /100 | #305 | Tragic $72,588 |
Demographics Similar to Sierra Leoneans by Median Household Income
In terms of median household income, the demographic groups most similar to Sierra Leoneans are Polish ($88,472, a difference of 0.010%), Immigrants from Sierra Leone ($88,498, a difference of 0.040%), Swedish ($88,524, a difference of 0.070%), Arab ($88,398, a difference of 0.070%), and Immigrants from Chile ($88,388, a difference of 0.080%).
| Demographics | Rating | Rank | Median Household Income |
| British | 92.0 /100 | #130 | Exceptional $88,914 |
| Immigrants | Syria | 91.4 /100 | #131 | Exceptional $88,792 |
| Europeans | 91.2 /100 | #132 | Exceptional $88,751 |
| Immigrants | Ethiopia | 90.9 /100 | #133 | Exceptional $88,687 |
| Swedes | 90.0 /100 | #134 | Exceptional $88,524 |
| Immigrants | Sierra Leone | 89.9 /100 | #135 | Excellent $88,498 |
| Poles | 89.7 /100 | #136 | Excellent $88,472 |
| Sierra Leoneans | 89.6 /100 | #137 | Excellent $88,463 |
| Arabs | 89.2 /100 | #138 | Excellent $88,398 |
| Immigrants | Chile | 89.2 /100 | #139 | Excellent $88,388 |
| Lebanese | 87.2 /100 | #140 | Excellent $88,091 |
| Immigrants | Morocco | 86.0 /100 | #141 | Excellent $87,930 |
| Canadians | 84.7 /100 | #142 | Excellent $87,769 |
| Danes | 83.9 /100 | #143 | Excellent $87,676 |
| Serbians | 83.0 /100 | #144 | Excellent $87,572 |