Paiute vs Immigrants from Lithuania Median Female Earnings
COMPARE
Paiute
Immigrants from Lithuania
Median Female Earnings
Median Female Earnings Comparison
Paiute
Immigrants from Lithuania
$36,056
MEDIAN FEMALE EARNINGS
0.1/ 100
METRIC RATING
285th/ 347
METRIC RANK
$43,317
MEDIAN FEMALE EARNINGS
99.9/ 100
METRIC RATING
52nd/ 347
METRIC RANK
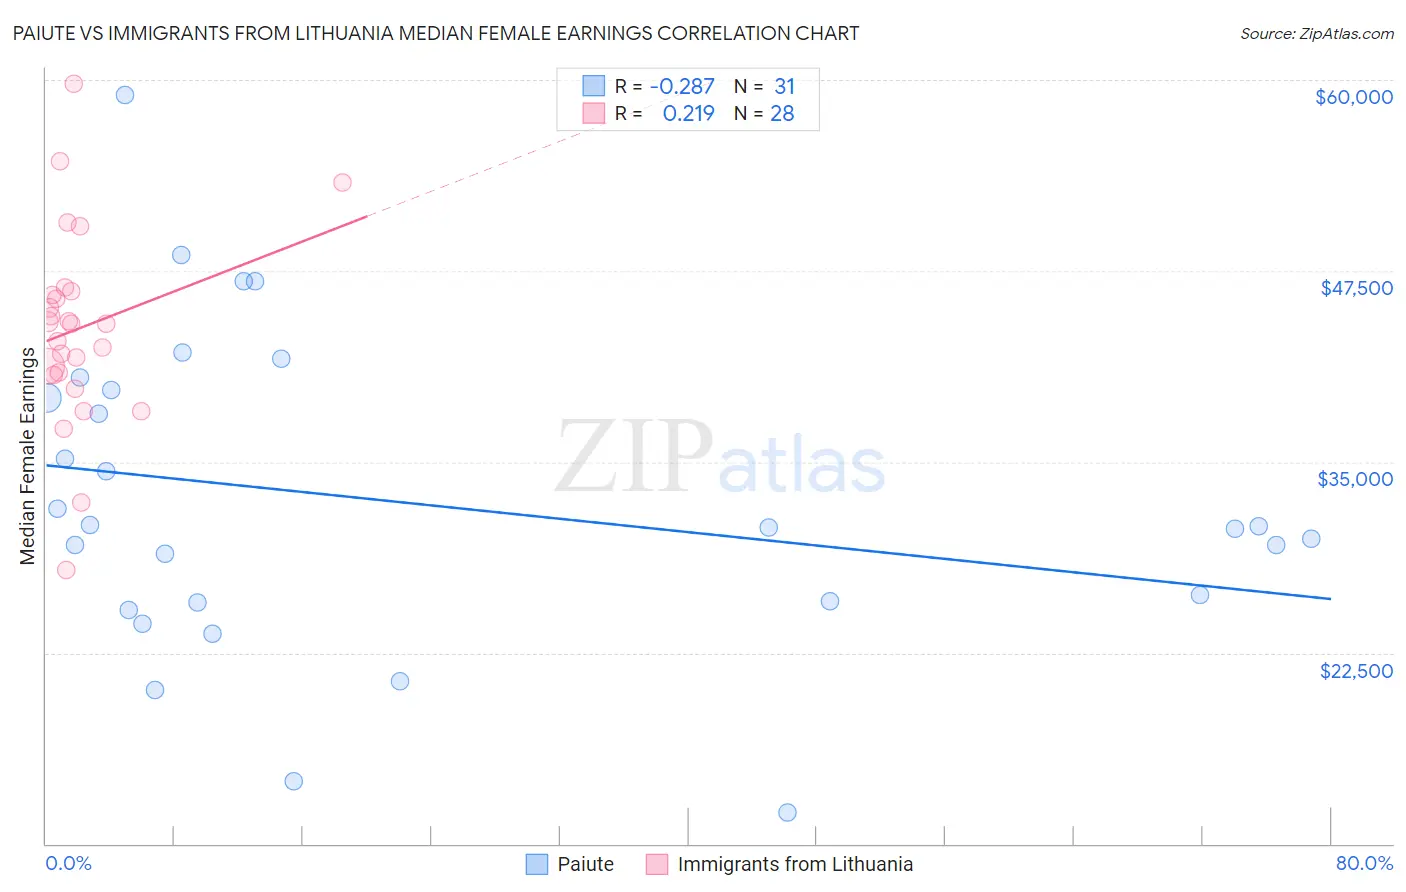
Paiute vs Immigrants from Lithuania Median Female Earnings Correlation Chart
The statistical analysis conducted on geographies consisting of 58,379,978 people shows a weak negative correlation between the proportion of Paiute and median female earnings in the United States with a correlation coefficient (R) of -0.287 and weighted average of $36,056. Similarly, the statistical analysis conducted on geographies consisting of 117,702,564 people shows a weak positive correlation between the proportion of Immigrants from Lithuania and median female earnings in the United States with a correlation coefficient (R) of 0.219 and weighted average of $43,317, a difference of 20.1%.
Median Female Earnings Correlation Summary
| Measurement | Paiute | Immigrants from Lithuania |
| Minimum | $12,045 | $27,947 |
| Maximum | $59,011 | $59,782 |
| Range | $46,966 | $31,835 |
| Mean | $32,370 | $43,754 |
| Median | $30,682 | $44,042 |
| Interquartile 25% (IQ1) | $25,816 | $40,753 |
| Interquartile 75% (IQ3) | $39,733 | $46,071 |
| Interquartile Range (IQR) | $13,917 | $5,319 |
| Standard Deviation (Sample) | $10,286 | $6,428 |
| Standard Deviation (Population) | $10,119 | $6,312 |
Similar Demographics by Median Female Earnings
Demographics Similar to Paiute by Median Female Earnings
In terms of median female earnings, the demographic groups most similar to Paiute are Osage ($36,034, a difference of 0.060%), Immigrants from Nicaragua ($36,023, a difference of 0.090%), Immigrants from Zaire ($36,017, a difference of 0.11%), Indonesian ($36,140, a difference of 0.23%), and Bangladeshi ($35,960, a difference of 0.27%).
| Demographics | Rating | Rank | Median Female Earnings |
| U.S. Virgin Islanders | 0.1 /100 | #278 | Tragic $36,424 |
| Immigrants | Caribbean | 0.1 /100 | #279 | Tragic $36,414 |
| Iroquois | 0.1 /100 | #280 | Tragic $36,408 |
| Spanish Americans | 0.1 /100 | #281 | Tragic $36,391 |
| Haitians | 0.1 /100 | #282 | Tragic $36,374 |
| Immigrants | Haiti | 0.1 /100 | #283 | Tragic $36,203 |
| Indonesians | 0.1 /100 | #284 | Tragic $36,140 |
| Paiute | 0.1 /100 | #285 | Tragic $36,056 |
| Osage | 0.0 /100 | #286 | Tragic $36,034 |
| Immigrants | Nicaragua | 0.0 /100 | #287 | Tragic $36,023 |
| Immigrants | Zaire | 0.0 /100 | #288 | Tragic $36,017 |
| Bangladeshis | 0.0 /100 | #289 | Tragic $35,960 |
| Central American Indians | 0.0 /100 | #290 | Tragic $35,930 |
| Blackfeet | 0.0 /100 | #291 | Tragic $35,864 |
| Americans | 0.0 /100 | #292 | Tragic $35,777 |
Demographics Similar to Immigrants from Lithuania by Median Female Earnings
In terms of median female earnings, the demographic groups most similar to Immigrants from Lithuania are Immigrants from Eastern Europe ($43,309, a difference of 0.020%), Australian ($43,308, a difference of 0.020%), Egyptian ($43,305, a difference of 0.030%), Maltese ($43,357, a difference of 0.090%), and Immigrants from Uzbekistan ($43,363, a difference of 0.11%).
| Demographics | Rating | Rank | Median Female Earnings |
| Immigrants | Europe | 100.0 /100 | #45 | Exceptional $43,523 |
| Immigrants | Bolivia | 100.0 /100 | #46 | Exceptional $43,467 |
| Bolivians | 100.0 /100 | #47 | Exceptional $43,445 |
| Immigrants | Indonesia | 100.0 /100 | #48 | Exceptional $43,412 |
| Immigrants | Serbia | 100.0 /100 | #49 | Exceptional $43,385 |
| Immigrants | Uzbekistan | 100.0 /100 | #50 | Exceptional $43,363 |
| Maltese | 100.0 /100 | #51 | Exceptional $43,357 |
| Immigrants | Lithuania | 99.9 /100 | #52 | Exceptional $43,317 |
| Immigrants | Eastern Europe | 99.9 /100 | #53 | Exceptional $43,309 |
| Australians | 99.9 /100 | #54 | Exceptional $43,308 |
| Egyptians | 99.9 /100 | #55 | Exceptional $43,305 |
| Immigrants | Croatia | 99.9 /100 | #56 | Exceptional $43,258 |
| Ethiopians | 99.9 /100 | #57 | Exceptional $43,243 |
| Paraguayans | 99.9 /100 | #58 | Exceptional $43,173 |
| Estonians | 99.9 /100 | #59 | Exceptional $43,106 |