Paiute vs Bhutanese Householder Income Ages 25 - 44 years

COMPARE

Paiute
Race
Ancestry
AfghanAfricanAlaska NativeAlaskan AthabascanAlbanianAleutAlsatianAmericanApacheArabArapahoArgentineanArmenianAssyrian/Chaldean/SyriacAustralianAustrianBahamianBangladeshiBarbadianBasqueBelgianBelizeanBermudanBlackfeetBolivianBrazilianBritishBritish West IndianBulgarianBurmeseCajunCambodianCanadianCape VerdeanCarpatho RusynCelticCentral AmericanCentral American IndianCherokeeCheyenneChickasawChileanChineseChippewaChoctawColombianColvilleComancheCosta RicanCreeCreekCroatianCrowCubanCypriotCzechCzechoslovakianDanishDelawareDominicanDutchDutch West IndianEastern EuropeanEcuadorianEgyptianEnglishEstonianEthiopianEuropeanFijianFilipinoFinnishFrenchFrench American IndianFrench CanadianGermanGerman RussianGhanaianGreekGuamanian/ChamorroGuatemalanGuyaneseHaitianHmongHonduranHopiHoumaHungarianIcelanderIndian (Asian)IndonesianInupiatIranianIraqiIrishIroquoisIsraeliItalianJamaicanJapaneseJordanianKenyanKiowaKoreanLaotianLatvianLebaneseLiberianLithuanianLumbeeLuxembourgerMacedonianMalaysianMalteseMarshalleseMenomineeMexicanMexican American IndianMongolianMoroccanNative HawaiianNavajoNepaleseNew ZealanderNicaraguanNigerianNorthern EuropeanNorwegianOkinawanOsageOttawaPaiutePakistaniPalestinianPanamanianParaguayanPennsylvania GermanPeruvianPimaPolishPortuguesePotawatomiPuebloPuerto RicanPuget Sound SalishRomanianRussianSalvadoranSamoanScandinavianScotch-IrishScottishSeminoleSenegaleseSerbianShoshoneSierra LeoneanSiouxSlavicSlovakSloveneSomaliSouth AfricanSouth AmericanSouth American IndianSoviet UnionSpaniardSpanishSpanish AmericanSpanish American IndianSri LankanSubsaharan AfricanSudaneseSwedishSwissSyrianTaiwaneseThaiTlingit-HaidaTohono O'OdhamTonganTrinidadian and TobagonianTsimshianTurkishU.S. Virgin IslanderUgandanUkrainianUruguayanUteVenezuelanVietnameseWelshWest IndianYakamaYaquiYugoslavianYumanYup'ikZimbabwean
Immigration
NonimmigrantsImmigrantsAfghanistanAfricaAlbaniaArgentinaArmeniaAsiaAustraliaAustriaBahamasBangladeshBarbadosBelarusBelgiumBelizeBoliviaBosnia and HerzegovinaBrazilBulgariaBurma/MyanmarCabo VerdeCambodiaCameroonCanadaCaribbeanCentral AmericaChileChinaColombiaCongoCosta RicaCroatiaCubaCzechoslovakiaDenmarkDominicaDominican RepublicEastern AfricaEastern AsiaEastern EuropeEcuadorEgyptEl SalvadorEnglandEritreaEthiopiaEuropeFijiFranceGermanyGhanaGreeceGrenadaGuatemalaGuyanaHaitiHondurasHong KongHungaryIndiaIndonesiaIranIraqIrelandIsraelItalyJamaicaJapanJordanKazakhstanKenyaKoreaKuwaitLaosLatin AmericaLatviaLebanonLiberiaLithuaniaMalaysiaMexicoMicronesiaMiddle AfricaMoldovaMoroccoNepalNetherlandsNicaraguaNigeriaNorth AmericaNorth MacedoniaNorthern AfricaNorthern EuropeNorwayOceaniaPakistanPanamaPeruPhilippinesPolandPortugalRomaniaRussiaSaudi ArabiaScotlandSenegalSerbiaSierra LeoneSingaporeSomaliaSouth AfricaSouth AmericaSouth Central AsiaSouth Eastern AsiaSouthern EuropeSpainSri LankaSt. Vincent and the GrenadinesSudanSwedenSwitzerlandSyriaTaiwanThailandTrinidad and TobagoTurkeyUgandaUkraineUruguayUzbekistanVenezuelaVietnamWest IndiesWestern AfricaWestern AsiaWestern EuropeYemenZaireZimbabweAzores
Bhutanese
Race
Ancestry
AfghanAfricanAlaska NativeAlaskan AthabascanAlbanianAleutAlsatianAmericanApacheArabArapahoArgentineanArmenianAssyrian/Chaldean/SyriacAustralianAustrianBahamianBangladeshiBarbadianBasqueBelgianBelizeanBermudanBhutaneseBlackfeetBolivianBrazilianBritishBritish West IndianBulgarianBurmeseCajunCambodianCanadianCape VerdeanCarpatho RusynCelticCentral AmericanCentral American IndianCherokeeCheyenneChickasawChileanChineseChippewaChoctawColombianColvilleComancheCosta RicanCreeCreekCroatianCrowCubanCypriotCzechCzechoslovakianDanishDelawareDominicanDutchDutch West IndianEastern EuropeanEcuadorianEgyptianEnglishEstonianEthiopianEuropeanFijianFilipinoFinnishFrenchFrench American IndianFrench CanadianGermanGerman RussianGhanaianGreekGuamanian/ChamorroGuatemalanGuyaneseHaitianHmongHonduranHopiHoumaHungarianIcelanderIndian (Asian)IndonesianInupiatIranianIraqiIrishIroquoisIsraeliItalianJamaicanJapaneseJordanianKenyanKiowaKoreanLaotianLatvianLebaneseLiberianLithuanianLumbeeLuxembourgerMacedonianMalaysianMalteseMarshalleseMenomineeMexicanMexican American IndianMongolianMoroccanNative HawaiianNavajoNepaleseNew ZealanderNicaraguanNigerianNorthern EuropeanNorwegianOkinawanOsageOttawaPakistaniPalestinianPanamanianParaguayanPennsylvania GermanPeruvianPimaPolishPortuguesePotawatomiPuebloPuerto RicanPuget Sound SalishRomanianRussianSalvadoranSamoanScandinavianScotch-IrishScottishSeminoleSenegaleseSerbianShoshoneSierra LeoneanSiouxSlavicSlovakSloveneSomaliSouth AfricanSouth AmericanSouth American IndianSoviet UnionSpaniardSpanishSpanish AmericanSpanish American IndianSri LankanSubsaharan AfricanSudaneseSwedishSwissSyrianTaiwaneseThaiTlingit-HaidaTohono O'OdhamTonganTrinidadian and TobagonianTsimshianTurkishU.S. Virgin IslanderUgandanUkrainianUruguayanUteVenezuelanVietnameseWelshWest IndianYakamaYaquiYugoslavianYumanYup'ikZimbabwean
Immigration
NonimmigrantsImmigrantsAfghanistanAfricaAlbaniaArgentinaArmeniaAsiaAustraliaAustriaBahamasBangladeshBarbadosBelarusBelgiumBelizeBoliviaBosnia and HerzegovinaBrazilBulgariaBurma/MyanmarCabo VerdeCambodiaCameroonCanadaCaribbeanCentral AmericaChileChinaColombiaCongoCosta RicaCroatiaCubaCzechoslovakiaDenmarkDominicaDominican RepublicEastern AfricaEastern AsiaEastern EuropeEcuadorEgyptEl SalvadorEnglandEritreaEthiopiaEuropeFijiFranceGermanyGhanaGreeceGrenadaGuatemalaGuyanaHaitiHondurasHong KongHungaryIndiaIndonesiaIranIraqIrelandIsraelItalyJamaicaJapanJordanKazakhstanKenyaKoreaKuwaitLaosLatin AmericaLatviaLebanonLiberiaLithuaniaMalaysiaMexicoMicronesiaMiddle AfricaMoldovaMoroccoNepalNetherlandsNicaraguaNigeriaNorth AmericaNorth MacedoniaNorthern AfricaNorthern EuropeNorwayOceaniaPakistanPanamaPeruPhilippinesPolandPortugalRomaniaRussiaSaudi ArabiaScotlandSenegalSerbiaSierra LeoneSingaporeSomaliaSouth AfricaSouth AmericaSouth Central AsiaSouth Eastern AsiaSouthern EuropeSpainSri LankaSt. Vincent and the GrenadinesSudanSwedenSwitzerlandSyriaTaiwanThailandTrinidad and TobagoTurkeyUgandaUkraineUruguayUzbekistanVenezuelaVietnamWest IndiesWestern AfricaWestern AsiaWestern EuropeYemenZaireZimbabweAzores
Householder Income Ages 25 - 44 years
Income
Poverty
Unemployment
Labor Participation
Family Structure
Vehicle Availability
Education Level
Disability

Householder Income Ages 25 - 44 years Comparison

Paiute

Bhutanese

Tragic
Exceptional
$82,984
HOUSEHOLDER INCOME AGES 25 - 44 YEARS
0.2/ 100
METRIC RATING
277th/ 347
METRIC RANK
$109,520
HOUSEHOLDER INCOME AGES 25 - 44 YEARS
100.0/ 100
METRIC RATING
33rd/ 347
METRIC RANK

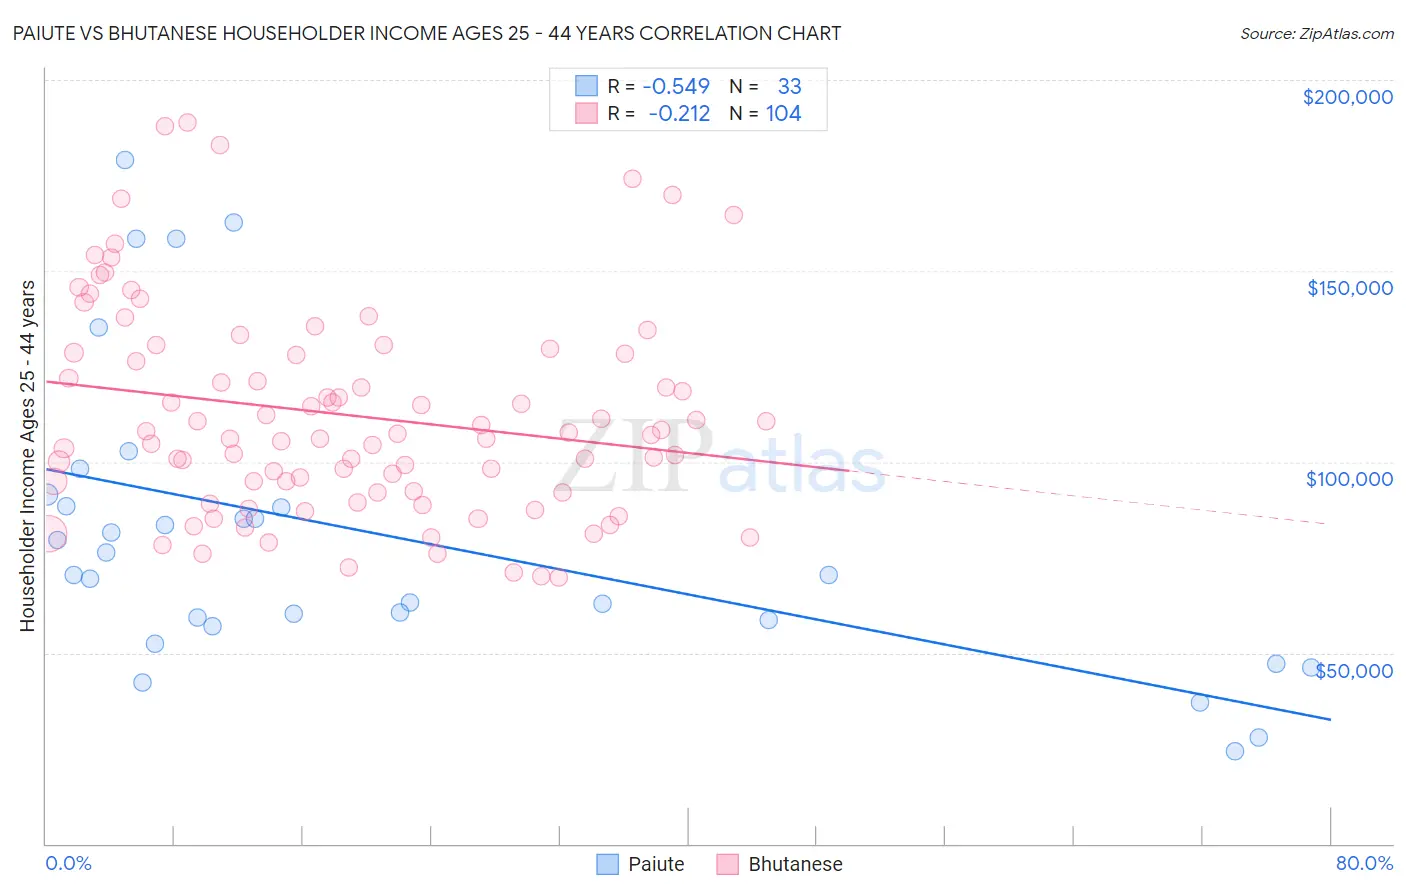
Paiute vs Bhutanese Householder Income Ages 25 - 44 years Correlation Chart

The statistical analysis conducted on geographies consisting of 58,335,630 people shows a substantial negative correlation between the proportion of Paiute and household income with householder between the ages 25 and 44 in the United States with a correlation coefficient (R) of -0.549 and weighted average of $82,984. Similarly, the statistical analysis conducted on geographies consisting of 454,022,239 people shows a weak negative correlation between the proportion of Bhutanese and household income with householder between the ages 25 and 44 in the United States with a correlation coefficient (R) of -0.212 and weighted average of $109,520, a difference of 32.0%.
Paiute vs Bhutanese Householder Income Ages 25 - 44 years

Householder Income Ages 25 - 44 years Correlation Summary

MeasurementPaiuteBhutanese
Minimum$24,091$69,864
Maximum$179,063$188,962
Range$154,972$119,098
Mean$80,693$112,280
Median$70,417$107,164
Interquartile 25% (IQ1)$57,886$92,216
Interquartile 75% (IQ3)$89,878$128,400
Interquartile Range (IQR)$31,992$36,183
Standard Deviation (Sample)$38,861$27,356
Standard Deviation (Population)$38,267$27,224

Similar Demographics by Householder Income Ages 25 - 44 years

Demographics Similar to Paiute by Householder Income Ages 25 - 44 years

In terms of householder income ages 25 - 44 years, the demographic groups most similar to Paiute are Senegalese ($82,852, a difference of 0.16%), Immigrants from Belize ($83,141, a difference of 0.19%), Pima ($82,821, a difference of 0.20%), Immigrants from Jamaica ($83,298, a difference of 0.38%), and Colville ($82,604, a difference of 0.46%).
DemographicsRating | RankHouseholder Income Ages 25 - 44 years
Jamaicans
0.3
/100
|
#270
Tragic
$83,933
Somalis
0.2
/100
|
#271
Tragic
$83,752
Spanish Americans
0.2
/100
|
#272
Tragic
$83,722
Iroquois
0.2
/100
|
#273
Tragic
$83,682
Marshallese
0.2
/100
|
#274
Tragic
$83,575
Immigrants | Jamaica
0.2
/100
|
#275
Tragic
$83,298
Immigrants | Belize
0.2
/100
|
#276
Tragic
$83,141
Paiute
0.2
/100
|
#277
Tragic
$82,984
Senegalese
0.2
/100
|
#278
Tragic
$82,852
Pima
0.1
/100
|
#279
Tragic
$82,821
Colville
0.1
/100
|
#280
Tragic
$82,604
Cajuns
0.1
/100
|
#281
Tragic
$82,393
Central American Indians
0.1
/100
|
#282
Tragic
$82,355
Guatemalans
0.1
/100
|
#283
Tragic
$82,331
Immigrants | Middle Africa
0.1
/100
|
#284
Tragic
$82,254

Demographics Similar to Bhutanese by Householder Income Ages 25 - 44 years

In terms of householder income ages 25 - 44 years, the demographic groups most similar to Bhutanese are Bolivian ($109,372, a difference of 0.13%), Immigrants from Sri Lanka ($109,741, a difference of 0.20%), Immigrants from Switzerland ($109,185, a difference of 0.31%), Maltese ($110,064, a difference of 0.50%), and Immigrants from Greece ($110,103, a difference of 0.53%).
DemographicsRating | RankHouseholder Income Ages 25 - 44 years
Immigrants | Asia
100.0
/100
|
#26
Exceptional
$110,787
Russians
100.0
/100
|
#27
Exceptional
$110,398
Immigrants | Denmark
100.0
/100
|
#28
Exceptional
$110,363
Turks
100.0
/100
|
#29
Exceptional
$110,318
Immigrants | Greece
100.0
/100
|
#30
Exceptional
$110,103
Maltese
100.0
/100
|
#31
Exceptional
$110,064
Immigrants | Sri Lanka
100.0
/100
|
#32
Exceptional
$109,741
Bhutanese
100.0
/100
|
#33
Exceptional
$109,520
Bolivians
100.0
/100
|
#34
Exceptional
$109,372
Immigrants | Switzerland
100.0
/100
|
#35
Exceptional
$109,185
Latvians
100.0
/100
|
#36
Exceptional
$108,926
Immigrants | Russia
100.0
/100
|
#37
Exceptional
$108,751
Soviet Union
100.0
/100
|
#38
Exceptional
$108,457
Immigrants | France
99.9
/100
|
#39
Exceptional
$108,257
Immigrants | Lithuania
99.9
/100
|
#40
Exceptional
$108,149