Ottawa vs Immigrants from Guatemala Median Male Earnings
COMPARE
Ottawa
Immigrants from Guatemala
Median Male Earnings
Median Male Earnings Comparison
Ottawa
Immigrants from Guatemala
$46,611
MEDIAN MALE EARNINGS
0.0/ 100
METRIC RATING
308th/ 347
METRIC RANK
$46,244
MEDIAN MALE EARNINGS
0.0/ 100
METRIC RATING
315th/ 347
METRIC RANK
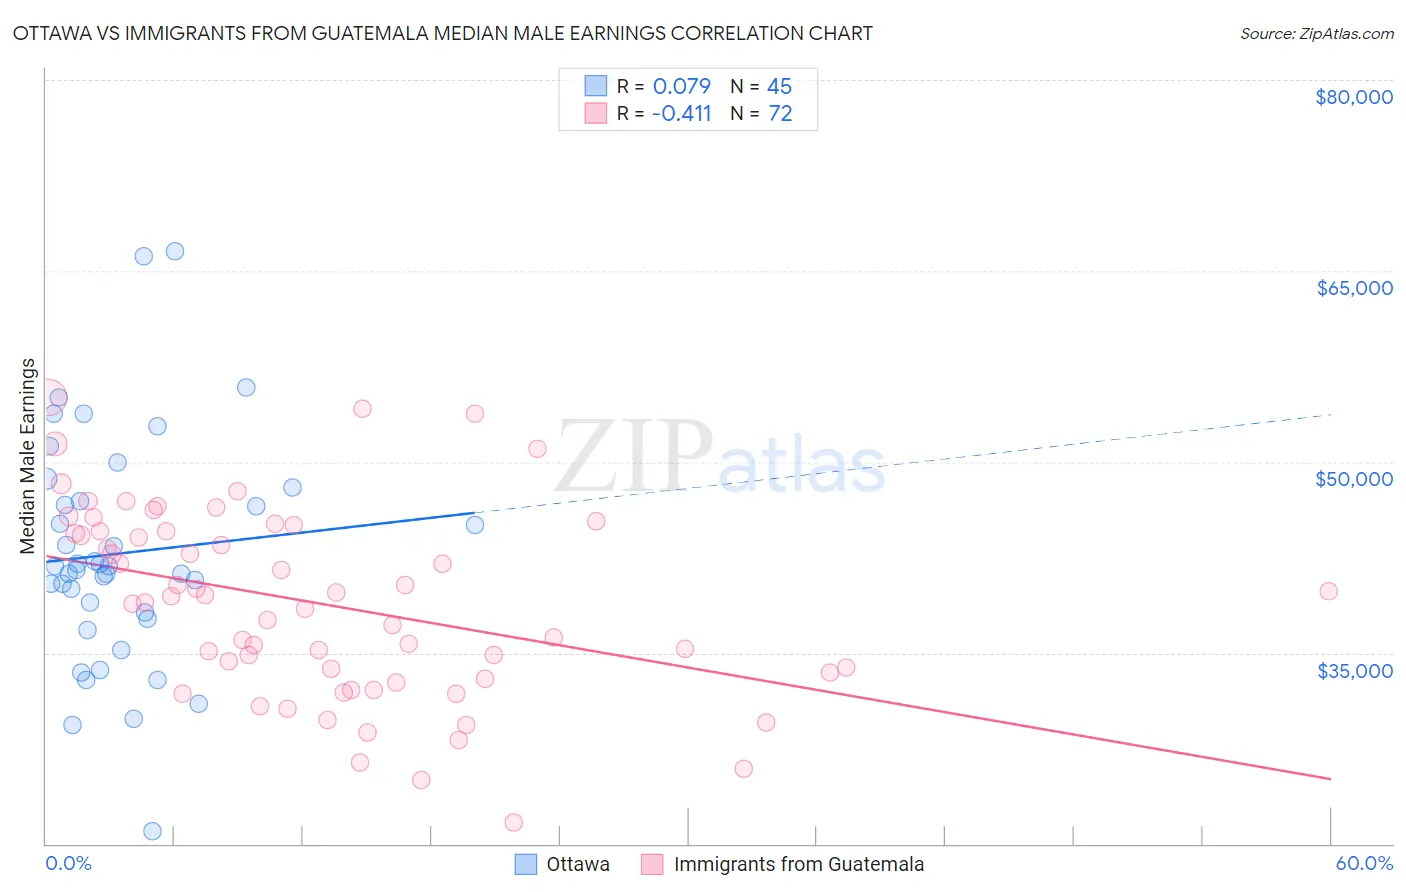
Ottawa vs Immigrants from Guatemala Median Male Earnings Correlation Chart
The statistical analysis conducted on geographies consisting of 49,954,818 people shows a slight positive correlation between the proportion of Ottawa and median male earnings in the United States with a correlation coefficient (R) of 0.079 and weighted average of $46,611. Similarly, the statistical analysis conducted on geographies consisting of 377,185,627 people shows a moderate negative correlation between the proportion of Immigrants from Guatemala and median male earnings in the United States with a correlation coefficient (R) of -0.411 and weighted average of $46,244, a difference of 0.79%.
Median Male Earnings Correlation Summary
| Measurement | Ottawa | Immigrants from Guatemala |
| Minimum | $20,938 | $21,641 |
| Maximum | $66,563 | $55,102 |
| Range | $45,625 | $33,461 |
| Mean | $42,823 | $38,841 |
| Median | $41,768 | $39,223 |
| Interquartile 25% (IQ1) | $37,908 | $33,223 |
| Interquartile 75% (IQ3) | $47,441 | $44,533 |
| Interquartile Range (IQR) | $9,533 | $11,310 |
| Standard Deviation (Sample) | $8,970 | $7,423 |
| Standard Deviation (Population) | $8,870 | $7,371 |
Demographics Similar to Ottawa and Immigrants from Guatemala by Median Male Earnings
In terms of median male earnings, the demographic groups most similar to Ottawa are Creek ($46,594, a difference of 0.040%), Cuban ($46,580, a difference of 0.070%), Immigrants from Dominican Republic ($46,655, a difference of 0.090%), Dutch West Indian ($46,656, a difference of 0.10%), and Guatemalan ($46,736, a difference of 0.27%). Similarly, the demographic groups most similar to Immigrants from Guatemala are Immigrants from Caribbean ($46,193, a difference of 0.11%), Mexican ($46,147, a difference of 0.21%), Chippewa ($46,368, a difference of 0.27%), Honduran ($46,374, a difference of 0.28%), and Hispanic or Latino ($46,419, a difference of 0.38%).
| Demographics | Rating | Rank | Median Male Earnings |
| Immigrants | Latin America | 0.1 /100 | #301 | Tragic $46,941 |
| Seminole | 0.1 /100 | #302 | Tragic $46,783 |
| Yaqui | 0.1 /100 | #303 | Tragic $46,777 |
| Bangladeshis | 0.1 /100 | #304 | Tragic $46,744 |
| Guatemalans | 0.0 /100 | #305 | Tragic $46,736 |
| Dutch West Indians | 0.0 /100 | #306 | Tragic $46,656 |
| Immigrants | Dominican Republic | 0.0 /100 | #307 | Tragic $46,655 |
| Ottawa | 0.0 /100 | #308 | Tragic $46,611 |
| Creek | 0.0 /100 | #309 | Tragic $46,594 |
| Cubans | 0.0 /100 | #310 | Tragic $46,580 |
| Apache | 0.0 /100 | #311 | Tragic $46,429 |
| Hispanics or Latinos | 0.0 /100 | #312 | Tragic $46,419 |
| Hondurans | 0.0 /100 | #313 | Tragic $46,374 |
| Chippewa | 0.0 /100 | #314 | Tragic $46,368 |
| Immigrants | Guatemala | 0.0 /100 | #315 | Tragic $46,244 |
| Immigrants | Caribbean | 0.0 /100 | #316 | Tragic $46,193 |
| Mexicans | 0.0 /100 | #317 | Tragic $46,147 |
| Cheyenne | 0.0 /100 | #318 | Tragic $46,062 |
| Haitians | 0.0 /100 | #319 | Tragic $45,903 |
| Immigrants | Honduras | 0.0 /100 | #320 | Tragic $45,787 |
| Fijians | 0.0 /100 | #321 | Tragic $45,607 |