Okinawan vs Immigrants from Latvia Householder Income Ages 45 - 64 years
COMPARE
Okinawan
Immigrants from Latvia
Householder Income Ages 45 - 64 years
Householder Income Ages 45 - 64 years Comparison
Okinawans
Immigrants from Latvia
$124,796
HOUSEHOLDER INCOME AGES 45 - 64 YEARS
100.0/ 100
METRIC RATING
9th/ 347
METRIC RANK
$111,454
HOUSEHOLDER INCOME AGES 45 - 64 YEARS
99.6/ 100
METRIC RATING
64th/ 347
METRIC RANK
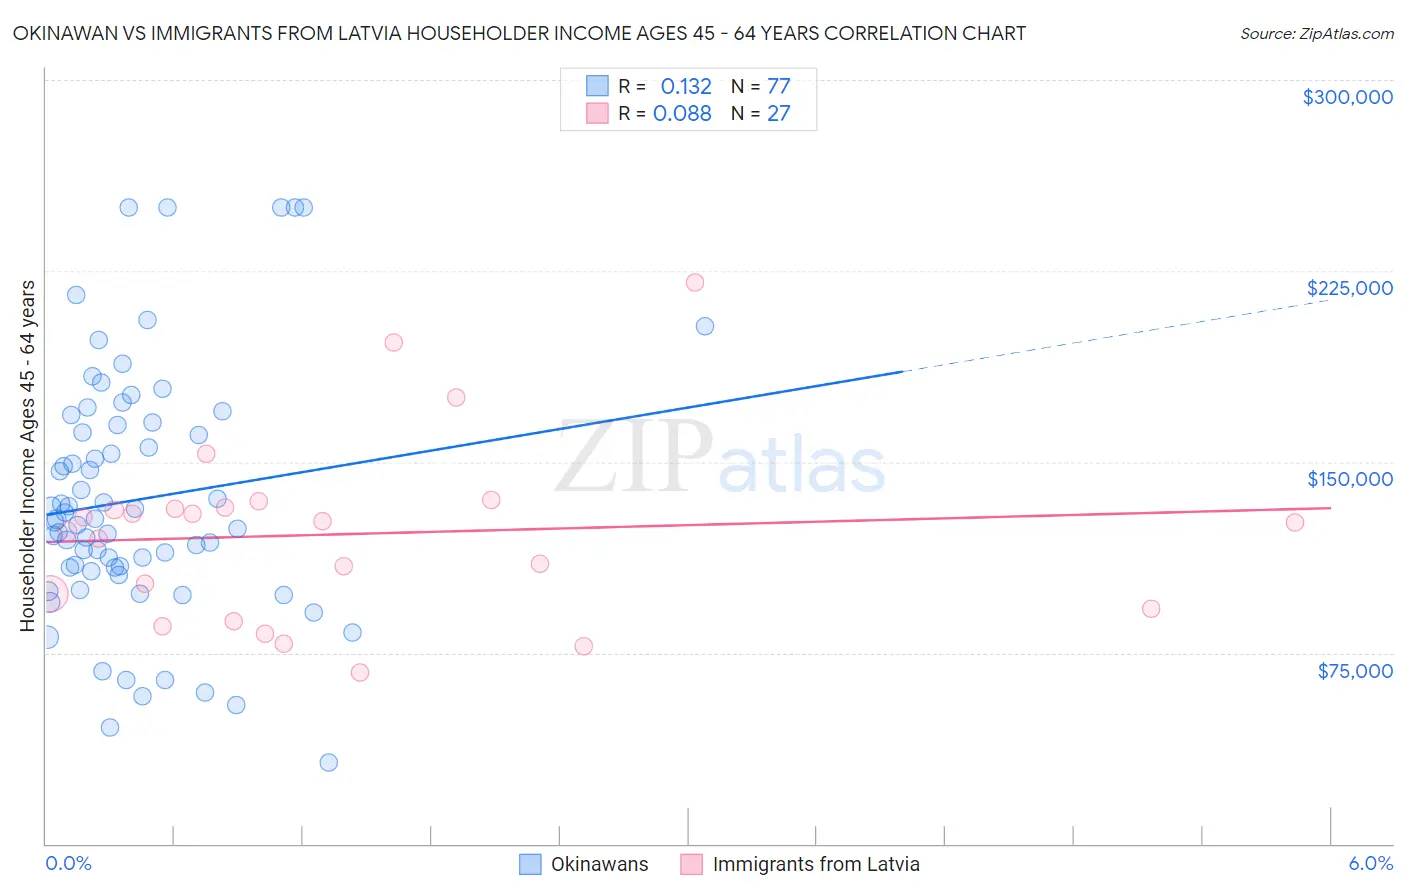
Okinawan vs Immigrants from Latvia Householder Income Ages 45 - 64 years Correlation Chart
The statistical analysis conducted on geographies consisting of 73,700,687 people shows a poor positive correlation between the proportion of Okinawans and household income with householder between the ages 45 and 64 in the United States with a correlation coefficient (R) of 0.132 and weighted average of $124,796. Similarly, the statistical analysis conducted on geographies consisting of 113,705,895 people shows a slight positive correlation between the proportion of Immigrants from Latvia and household income with householder between the ages 45 and 64 in the United States with a correlation coefficient (R) of 0.088 and weighted average of $111,454, a difference of 12.0%.
Householder Income Ages 45 - 64 years Correlation Summary
| Measurement | Okinawan | Immigrants from Latvia |
| Minimum | $31,848 | $67,390 |
| Maximum | $250,001 | $220,625 |
| Range | $218,153 | $153,235 |
| Mean | $135,211 | $121,613 |
| Median | $127,491 | $126,071 |
| Interquartile 25% (IQ1) | $107,731 | $92,091 |
| Interquartile 75% (IQ3) | $164,928 | $132,271 |
| Interquartile Range (IQR) | $57,197 | $40,180 |
| Standard Deviation (Sample) | $49,050 | $35,656 |
| Standard Deviation (Population) | $48,731 | $34,989 |
Similar Demographics by Householder Income Ages 45 - 64 years
Demographics Similar to Okinawans by Householder Income Ages 45 - 64 years
In terms of householder income ages 45 - 64 years, the demographic groups most similar to Okinawans are Immigrants from South Central Asia ($124,188, a difference of 0.49%), Cypriot ($123,396, a difference of 1.1%), Immigrants from Israel ($122,893, a difference of 1.5%), Immigrants from Ireland ($122,757, a difference of 1.7%), and Immigrants from Iran ($126,940, a difference of 1.7%).
| Demographics | Rating | Rank | Householder Income Ages 45 - 64 years |
| Filipinos | 100.0 /100 | #2 | Exceptional $134,910 |
| Immigrants | India | 100.0 /100 | #3 | Exceptional $132,488 |
| Thais | 100.0 /100 | #4 | Exceptional $129,560 |
| Immigrants | Singapore | 100.0 /100 | #5 | Exceptional $129,514 |
| Iranians | 100.0 /100 | #6 | Exceptional $129,350 |
| Immigrants | Hong Kong | 100.0 /100 | #7 | Exceptional $127,500 |
| Immigrants | Iran | 100.0 /100 | #8 | Exceptional $126,940 |
| Okinawans | 100.0 /100 | #9 | Exceptional $124,796 |
| Immigrants | South Central Asia | 100.0 /100 | #10 | Exceptional $124,188 |
| Cypriots | 100.0 /100 | #11 | Exceptional $123,396 |
| Immigrants | Israel | 100.0 /100 | #12 | Exceptional $122,893 |
| Immigrants | Ireland | 100.0 /100 | #13 | Exceptional $122,757 |
| Indians (Asian) | 100.0 /100 | #14 | Exceptional $122,343 |
| Immigrants | Eastern Asia | 100.0 /100 | #15 | Exceptional $122,222 |
| Immigrants | China | 100.0 /100 | #16 | Exceptional $122,178 |
Demographics Similar to Immigrants from Latvia by Householder Income Ages 45 - 64 years
In terms of householder income ages 45 - 64 years, the demographic groups most similar to Immigrants from Latvia are Immigrants from Belarus ($111,430, a difference of 0.020%), Mongolian ($111,602, a difference of 0.13%), New Zealander ($111,286, a difference of 0.15%), Immigrants from Norway ($111,669, a difference of 0.19%), and Laotian ($111,051, a difference of 0.36%).
| Demographics | Rating | Rank | Householder Income Ages 45 - 64 years |
| Immigrants | Scotland | 99.7 /100 | #57 | Exceptional $112,175 |
| Soviet Union | 99.7 /100 | #58 | Exceptional $112,008 |
| Immigrants | Europe | 99.7 /100 | #59 | Exceptional $111,984 |
| Immigrants | Netherlands | 99.7 /100 | #60 | Exceptional $111,982 |
| Immigrants | Czechoslovakia | 99.7 /100 | #61 | Exceptional $111,914 |
| Immigrants | Norway | 99.7 /100 | #62 | Exceptional $111,669 |
| Mongolians | 99.6 /100 | #63 | Exceptional $111,602 |
| Immigrants | Latvia | 99.6 /100 | #64 | Exceptional $111,454 |
| Immigrants | Belarus | 99.6 /100 | #65 | Exceptional $111,430 |
| New Zealanders | 99.6 /100 | #66 | Exceptional $111,286 |
| Laotians | 99.5 /100 | #67 | Exceptional $111,051 |
| Immigrants | Romania | 99.4 /100 | #68 | Exceptional $110,633 |
| Immigrants | Italy | 99.4 /100 | #69 | Exceptional $110,434 |
| Koreans | 99.3 /100 | #70 | Exceptional $110,334 |
| Italians | 99.3 /100 | #71 | Exceptional $110,224 |