Okinawan vs Immigrants from Austria Median Earnings
COMPARE
Okinawan
Immigrants from Austria
Median Earnings
Median Earnings Comparison
Okinawans
Immigrants from Austria
$57,550
MEDIAN EARNINGS
100.0/ 100
METRIC RATING
9th/ 347
METRIC RANK
$51,826
MEDIAN EARNINGS
99.9/ 100
METRIC RATING
51st/ 347
METRIC RANK
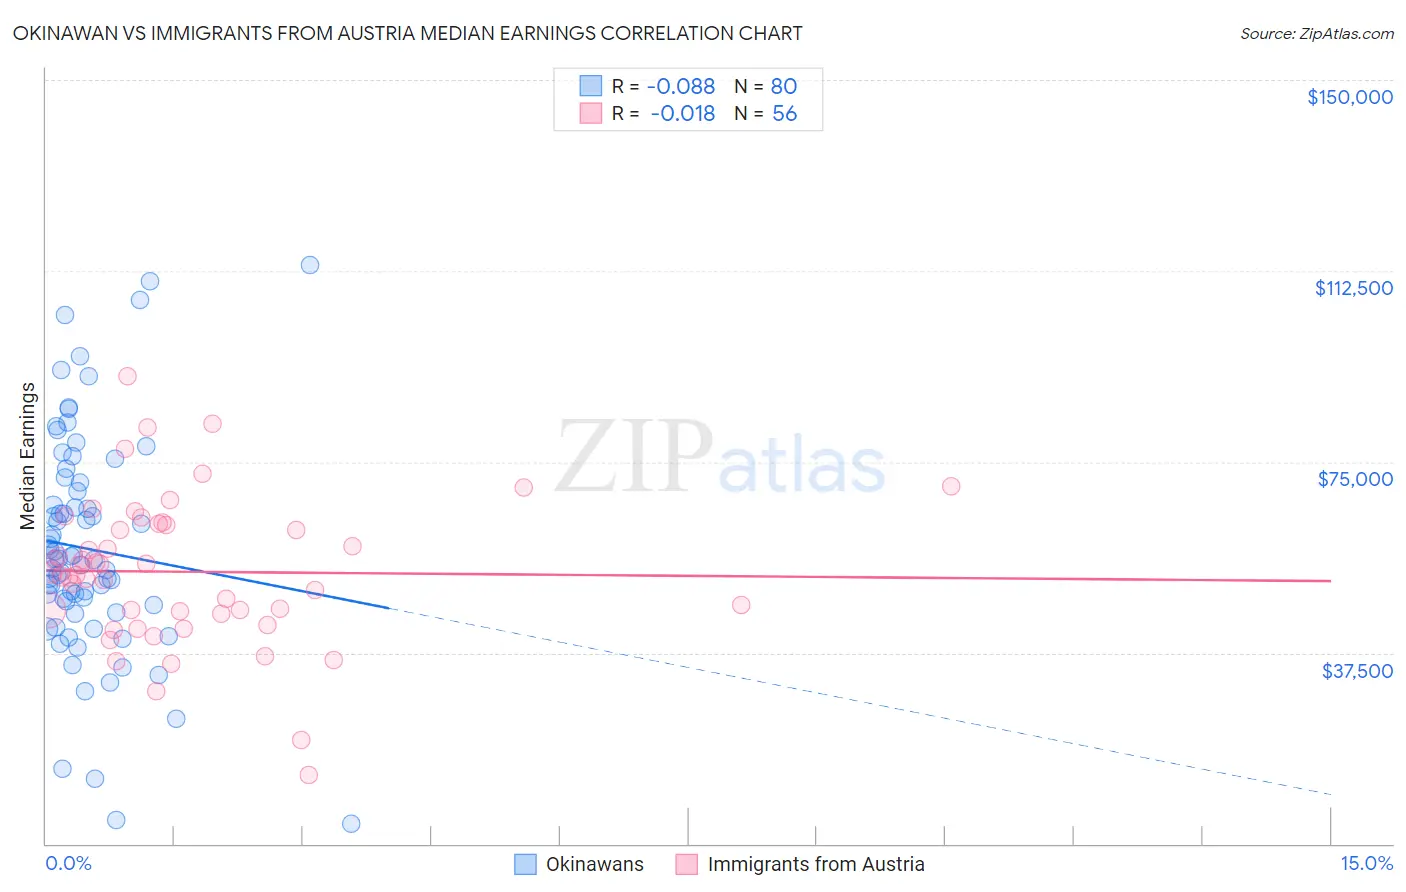
Okinawan vs Immigrants from Austria Median Earnings Correlation Chart
The statistical analysis conducted on geographies consisting of 73,779,677 people shows a slight negative correlation between the proportion of Okinawans and median earnings in the United States with a correlation coefficient (R) of -0.088 and weighted average of $57,550. Similarly, the statistical analysis conducted on geographies consisting of 167,962,840 people shows no correlation between the proportion of Immigrants from Austria and median earnings in the United States with a correlation coefficient (R) of -0.018 and weighted average of $51,826, a difference of 11.1%.
Median Earnings Correlation Summary
| Measurement | Okinawan | Immigrants from Austria |
| Minimum | $4,007 | $13,446 |
| Maximum | $113,728 | $91,775 |
| Range | $109,721 | $78,329 |
| Mean | $57,919 | $53,408 |
| Median | $55,875 | $52,944 |
| Interquartile 25% (IQ1) | $46,156 | $45,427 |
| Interquartile 75% (IQ3) | $70,001 | $62,672 |
| Interquartile Range (IQR) | $23,845 | $17,245 |
| Standard Deviation (Sample) | $21,992 | $14,505 |
| Standard Deviation (Population) | $21,854 | $14,375 |
Similar Demographics by Median Earnings
Demographics Similar to Okinawans by Median Earnings
In terms of median earnings, the demographic groups most similar to Okinawans are Immigrants from Iran ($57,612, a difference of 0.11%), Immigrants from South Central Asia ($57,114, a difference of 0.76%), Immigrants from Israel ($57,034, a difference of 0.90%), Immigrants from Ireland ($56,854, a difference of 1.2%), and Iranian ($58,474, a difference of 1.6%).
| Demographics | Rating | Rank | Median Earnings |
| Immigrants | Taiwan | 100.0 /100 | #2 | Exceptional $61,151 |
| Immigrants | India | 100.0 /100 | #3 | Exceptional $60,648 |
| Immigrants | Hong Kong | 100.0 /100 | #4 | Exceptional $59,433 |
| Thais | 100.0 /100 | #5 | Exceptional $59,237 |
| Immigrants | Singapore | 100.0 /100 | #6 | Exceptional $59,038 |
| Iranians | 100.0 /100 | #7 | Exceptional $58,474 |
| Immigrants | Iran | 100.0 /100 | #8 | Exceptional $57,612 |
| Okinawans | 100.0 /100 | #9 | Exceptional $57,550 |
| Immigrants | South Central Asia | 100.0 /100 | #10 | Exceptional $57,114 |
| Immigrants | Israel | 100.0 /100 | #11 | Exceptional $57,034 |
| Immigrants | Ireland | 100.0 /100 | #12 | Exceptional $56,854 |
| Immigrants | China | 100.0 /100 | #13 | Exceptional $56,638 |
| Immigrants | Australia | 100.0 /100 | #14 | Exceptional $56,305 |
| Indians (Asian) | 100.0 /100 | #15 | Exceptional $56,253 |
| Immigrants | Eastern Asia | 100.0 /100 | #16 | Exceptional $56,183 |
Demographics Similar to Immigrants from Austria by Median Earnings
In terms of median earnings, the demographic groups most similar to Immigrants from Austria are Immigrants from South Africa ($51,850, a difference of 0.050%), Estonian ($51,772, a difference of 0.10%), Immigrants from Norway ($51,758, a difference of 0.13%), Immigrants from Indonesia ($51,715, a difference of 0.21%), and Egyptian ($51,701, a difference of 0.24%).
| Demographics | Rating | Rank | Median Earnings |
| Bulgarians | 100.0 /100 | #44 | Exceptional $52,512 |
| Immigrants | Czechoslovakia | 100.0 /100 | #45 | Exceptional $52,361 |
| Bhutanese | 100.0 /100 | #46 | Exceptional $52,297 |
| Australians | 100.0 /100 | #47 | Exceptional $52,294 |
| Immigrants | Europe | 100.0 /100 | #48 | Exceptional $52,195 |
| Bolivians | 100.0 /100 | #49 | Exceptional $52,005 |
| Immigrants | South Africa | 100.0 /100 | #50 | Exceptional $51,850 |
| Immigrants | Austria | 99.9 /100 | #51 | Exceptional $51,826 |
| Estonians | 99.9 /100 | #52 | Exceptional $51,772 |
| Immigrants | Norway | 99.9 /100 | #53 | Exceptional $51,758 |
| Immigrants | Indonesia | 99.9 /100 | #54 | Exceptional $51,715 |
| Egyptians | 99.9 /100 | #55 | Exceptional $51,701 |
| Immigrants | Pakistan | 99.9 /100 | #56 | Exceptional $51,693 |
| Immigrants | Eastern Europe | 99.9 /100 | #57 | Exceptional $51,624 |
| Immigrants | Bolivia | 99.9 /100 | #58 | Exceptional $51,605 |