Norwegian vs Italian Householder Income Under 25 years
COMPARE
Norwegian
Italian
Householder Income Under 25 years
Householder Income Under 25 years Comparison
Norwegians
Italians
$53,127
HOUSEHOLDER INCOME UNDER 25 YEARS
90.8/ 100
METRIC RATING
138th/ 347
METRIC RANK
$53,426
HOUSEHOLDER INCOME UNDER 25 YEARS
95.4/ 100
METRIC RATING
119th/ 347
METRIC RANK
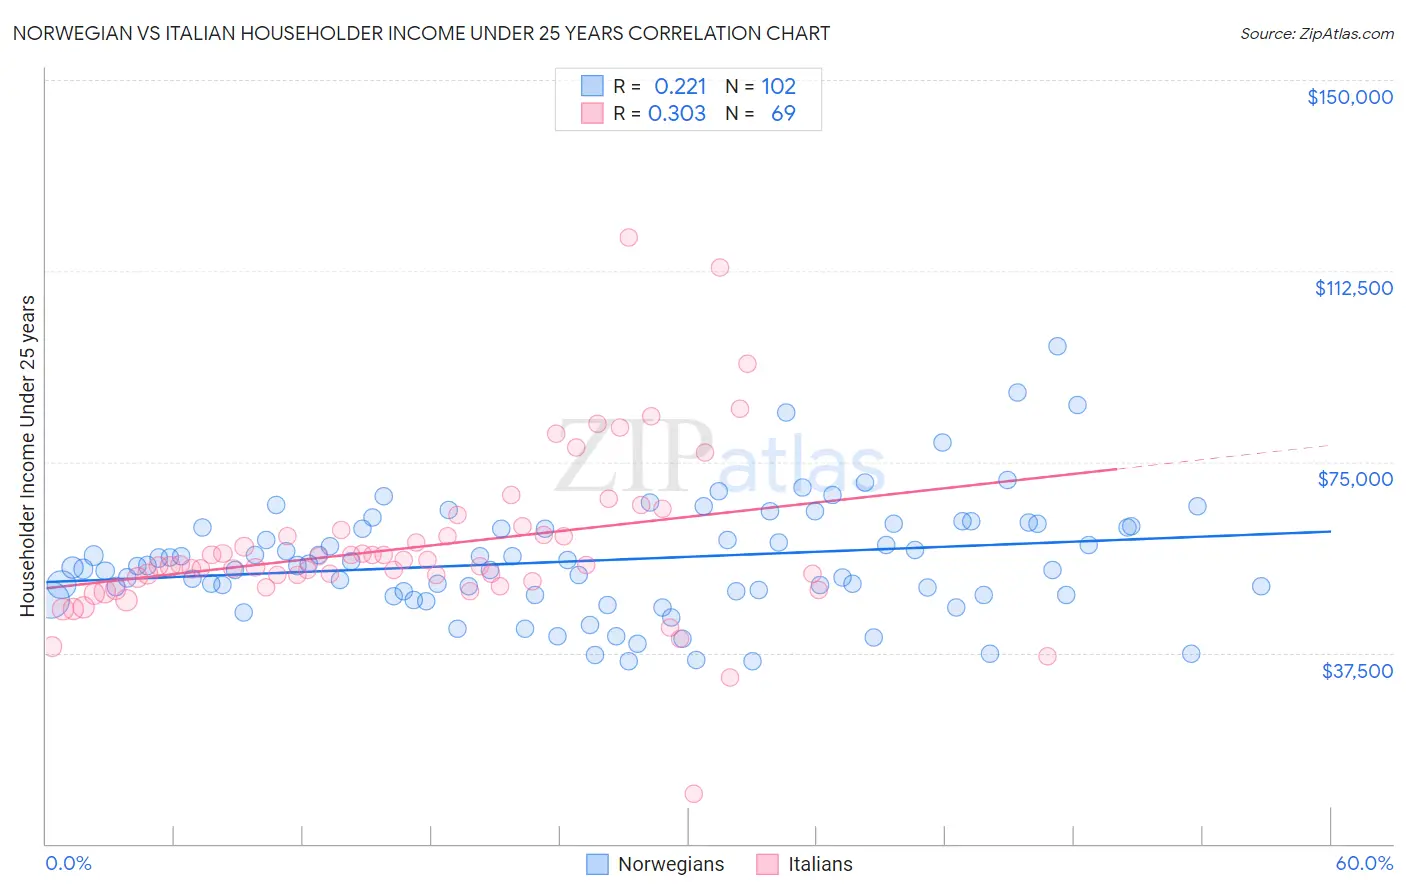
Norwegian vs Italian Householder Income Under 25 years Correlation Chart
The statistical analysis conducted on geographies consisting of 421,100,375 people shows a weak positive correlation between the proportion of Norwegians and household income with householder under the age of 25 in the United States with a correlation coefficient (R) of 0.221 and weighted average of $53,127. Similarly, the statistical analysis conducted on geographies consisting of 440,319,823 people shows a mild positive correlation between the proportion of Italians and household income with householder under the age of 25 in the United States with a correlation coefficient (R) of 0.303 and weighted average of $53,426, a difference of 0.56%.
Householder Income Under 25 years Correlation Summary
| Measurement | Norwegian | Italian |
| Minimum | $35,753 | $9,706 |
| Maximum | $97,750 | $119,083 |
| Range | $61,997 | $109,377 |
| Mean | $55,657 | $58,363 |
| Median | $54,551 | $54,623 |
| Interquartile 25% (IQ1) | $48,924 | $51,021 |
| Interquartile 75% (IQ3) | $62,074 | $61,158 |
| Interquartile Range (IQR) | $13,150 | $10,138 |
| Standard Deviation (Sample) | $11,328 | $16,327 |
| Standard Deviation (Population) | $11,273 | $16,208 |
Demographics Similar to Norwegians and Italians by Householder Income Under 25 years
In terms of householder income under 25 years, the demographic groups most similar to Norwegians are Immigrants from Barbados ($53,163, a difference of 0.070%), Armenian ($53,179, a difference of 0.10%), Immigrants from Northern Africa ($53,185, a difference of 0.11%), Chilean ($53,185, a difference of 0.11%), and Immigrants ($53,201, a difference of 0.14%). Similarly, the demographic groups most similar to Italians are Guamanian/Chamorro ($53,423, a difference of 0.010%), Immigrants from Canada ($53,411, a difference of 0.030%), Immigrants from Ethiopia ($53,408, a difference of 0.030%), Immigrants from Iraq ($53,384, a difference of 0.080%), and Colombian ($53,357, a difference of 0.13%).
| Demographics | Rating | Rank | Householder Income Under 25 years |
| Immigrants | Switzerland | 96.3 /100 | #118 | Exceptional $53,528 |
| Italians | 95.4 /100 | #119 | Exceptional $53,426 |
| Guamanians/Chamorros | 95.3 /100 | #120 | Exceptional $53,423 |
| Immigrants | Canada | 95.2 /100 | #121 | Exceptional $53,411 |
| Immigrants | Ethiopia | 95.2 /100 | #122 | Exceptional $53,408 |
| Immigrants | Iraq | 94.9 /100 | #123 | Exceptional $53,384 |
| Colombians | 94.6 /100 | #124 | Exceptional $53,357 |
| Pakistanis | 94.1 /100 | #125 | Exceptional $53,325 |
| Immigrants | Serbia | 94.1 /100 | #126 | Exceptional $53,321 |
| Immigrants | North America | 93.9 /100 | #127 | Exceptional $53,307 |
| Immigrants | Bulgaria | 93.9 /100 | #128 | Exceptional $53,305 |
| New Zealanders | 93.7 /100 | #129 | Exceptional $53,294 |
| Nicaraguans | 93.4 /100 | #130 | Exceptional $53,275 |
| Immigrants | Nicaragua | 93.3 /100 | #131 | Exceptional $53,266 |
| Moroccans | 93.1 /100 | #132 | Exceptional $53,256 |
| Immigrants | Immigrants | 92.2 /100 | #133 | Exceptional $53,201 |
| Immigrants | Northern Africa | 91.9 /100 | #134 | Exceptional $53,185 |
| Chileans | 91.9 /100 | #135 | Exceptional $53,185 |
| Armenians | 91.8 /100 | #136 | Exceptional $53,179 |
| Immigrants | Barbados | 91.5 /100 | #137 | Exceptional $53,163 |
| Norwegians | 90.8 /100 | #138 | Exceptional $53,127 |