Norwegian vs Immigrants from Taiwan Median Female Earnings
COMPARE
Norwegian
Immigrants from Taiwan
Median Female Earnings
Median Female Earnings Comparison
Norwegians
Immigrants from Taiwan
$38,802
MEDIAN FEMALE EARNINGS
13.4/ 100
METRIC RATING
209th/ 347
METRIC RANK
$49,256
MEDIAN FEMALE EARNINGS
100.0/ 100
METRIC RATING
3rd/ 347
METRIC RANK
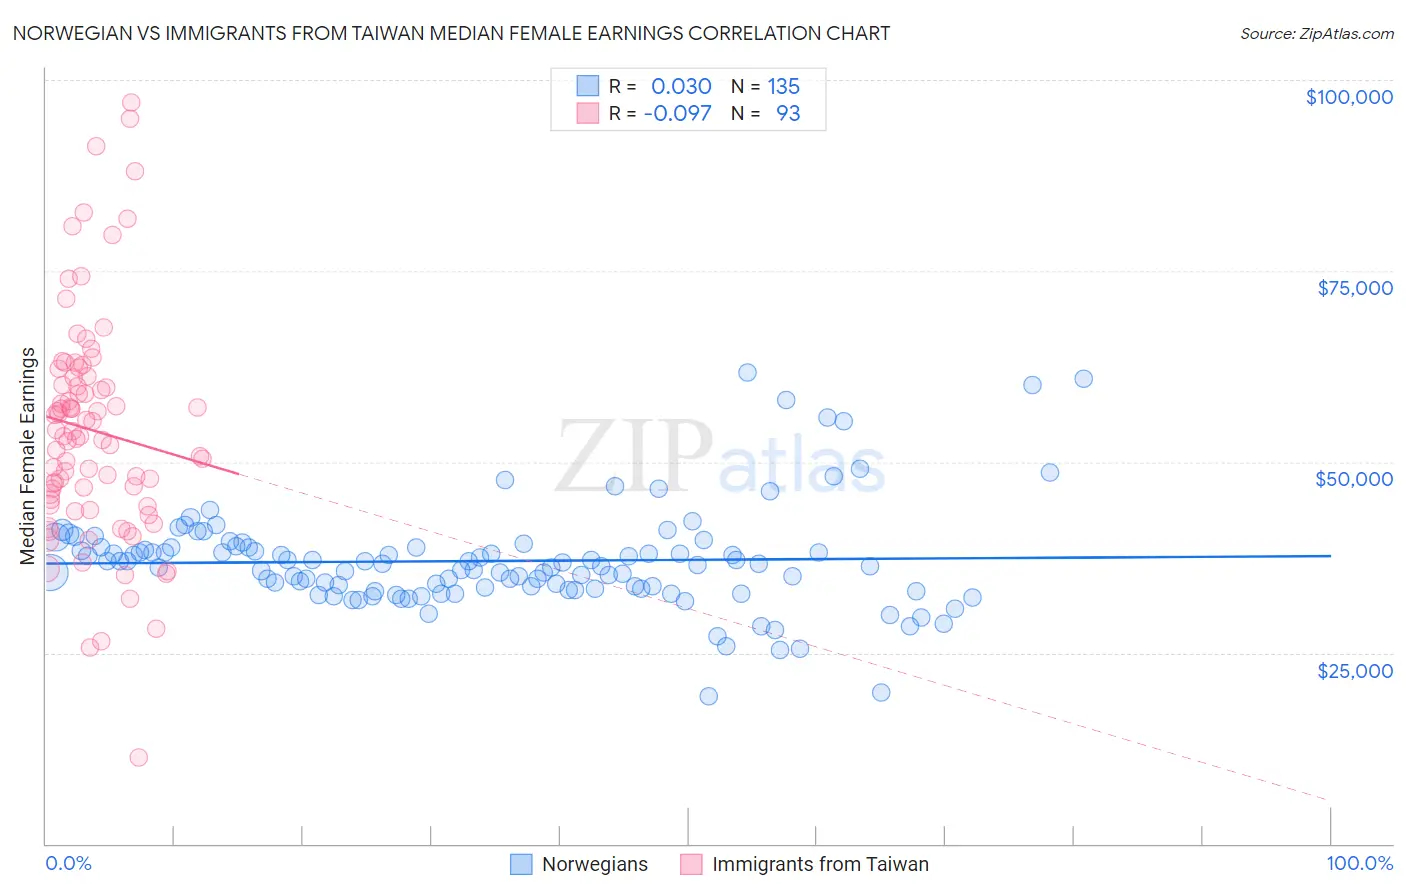
Norwegian vs Immigrants from Taiwan Median Female Earnings Correlation Chart
The statistical analysis conducted on geographies consisting of 532,275,567 people shows no correlation between the proportion of Norwegians and median female earnings in the United States with a correlation coefficient (R) of 0.030 and weighted average of $38,802. Similarly, the statistical analysis conducted on geographies consisting of 298,206,550 people shows a slight negative correlation between the proportion of Immigrants from Taiwan and median female earnings in the United States with a correlation coefficient (R) of -0.097 and weighted average of $49,256, a difference of 26.9%.
Median Female Earnings Correlation Summary
| Measurement | Norwegian | Immigrants from Taiwan |
| Minimum | $19,310 | $11,250 |
| Maximum | $61,750 | $97,064 |
| Range | $42,440 | $85,814 |
| Mean | $37,022 | $54,143 |
| Median | $36,510 | $53,398 |
| Interquartile 25% (IQ1) | $33,325 | $44,696 |
| Interquartile 75% (IQ3) | $38,843 | $61,160 |
| Interquartile Range (IQR) | $5,519 | $16,465 |
| Standard Deviation (Sample) | $6,760 | $14,938 |
| Standard Deviation (Population) | $6,735 | $14,857 |
Similar Demographics by Median Female Earnings
Demographics Similar to Norwegians by Median Female Earnings
In terms of median female earnings, the demographic groups most similar to Norwegians are Immigrants from Thailand ($38,810, a difference of 0.020%), Immigrants from Cambodia ($38,833, a difference of 0.080%), Czechoslovakian ($38,738, a difference of 0.17%), Aleut ($38,719, a difference of 0.21%), and Immigrants from Bosnia and Herzegovina ($38,886, a difference of 0.22%).
| Demographics | Rating | Rank | Median Female Earnings |
| Slovaks | 19.9 /100 | #202 | Poor $39,029 |
| Czechs | 18.7 /100 | #203 | Poor $38,992 |
| Immigrants | Uruguay | 17.3 /100 | #204 | Poor $38,945 |
| Immigrants | Colombia | 16.3 /100 | #205 | Poor $38,913 |
| Immigrants | Bosnia and Herzegovina | 15.6 /100 | #206 | Poor $38,886 |
| Immigrants | Cambodia | 14.2 /100 | #207 | Poor $38,833 |
| Immigrants | Thailand | 13.6 /100 | #208 | Poor $38,810 |
| Norwegians | 13.4 /100 | #209 | Poor $38,802 |
| Czechoslovakians | 12.0 /100 | #210 | Poor $38,738 |
| Aleuts | 11.6 /100 | #211 | Poor $38,719 |
| Guamanians/Chamorros | 11.5 /100 | #212 | Poor $38,717 |
| Jamaicans | 10.5 /100 | #213 | Poor $38,670 |
| Iraqis | 10.5 /100 | #214 | Poor $38,666 |
| Spaniards | 10.3 /100 | #215 | Poor $38,656 |
| Immigrants | Ecuador | 10.1 /100 | #216 | Poor $38,644 |
Demographics Similar to Immigrants from Taiwan by Median Female Earnings
In terms of median female earnings, the demographic groups most similar to Immigrants from Taiwan are Filipino ($49,508, a difference of 0.51%), Immigrants from Hong Kong ($49,818, a difference of 1.1%), Immigrants from India ($48,292, a difference of 2.0%), Immigrants from Singapore ($47,986, a difference of 2.6%), and Immigrants from Ireland ($47,598, a difference of 3.5%).
| Demographics | Rating | Rank | Median Female Earnings |
| Immigrants | Hong Kong | 100.0 /100 | #1 | Exceptional $49,818 |
| Filipinos | 100.0 /100 | #2 | Exceptional $49,508 |
| Immigrants | Taiwan | 100.0 /100 | #3 | Exceptional $49,256 |
| Immigrants | India | 100.0 /100 | #4 | Exceptional $48,292 |
| Immigrants | Singapore | 100.0 /100 | #5 | Exceptional $47,986 |
| Immigrants | Ireland | 100.0 /100 | #6 | Exceptional $47,598 |
| Thais | 100.0 /100 | #7 | Exceptional $47,577 |
| Iranians | 100.0 /100 | #8 | Exceptional $47,421 |
| Immigrants | Iran | 100.0 /100 | #9 | Exceptional $47,154 |
| Immigrants | China | 100.0 /100 | #10 | Exceptional $46,972 |
| Okinawans | 100.0 /100 | #11 | Exceptional $46,905 |
| Immigrants | Israel | 100.0 /100 | #12 | Exceptional $46,902 |
| Immigrants | Australia | 100.0 /100 | #13 | Exceptional $46,573 |
| Soviet Union | 100.0 /100 | #14 | Exceptional $46,556 |
| Immigrants | Eastern Asia | 100.0 /100 | #15 | Exceptional $46,502 |