Norwegian vs Apache Householder Income Ages 25 - 44 years
COMPARE
Norwegian
Apache
Householder Income Ages 25 - 44 years
Householder Income Ages 25 - 44 years Comparison
Norwegians
Apache
$96,866
HOUSEHOLDER INCOME AGES 25 - 44 YEARS
78.2/ 100
METRIC RATING
145th/ 347
METRIC RANK
$80,260
HOUSEHOLDER INCOME AGES 25 - 44 YEARS
0.0/ 100
METRIC RATING
306th/ 347
METRIC RANK
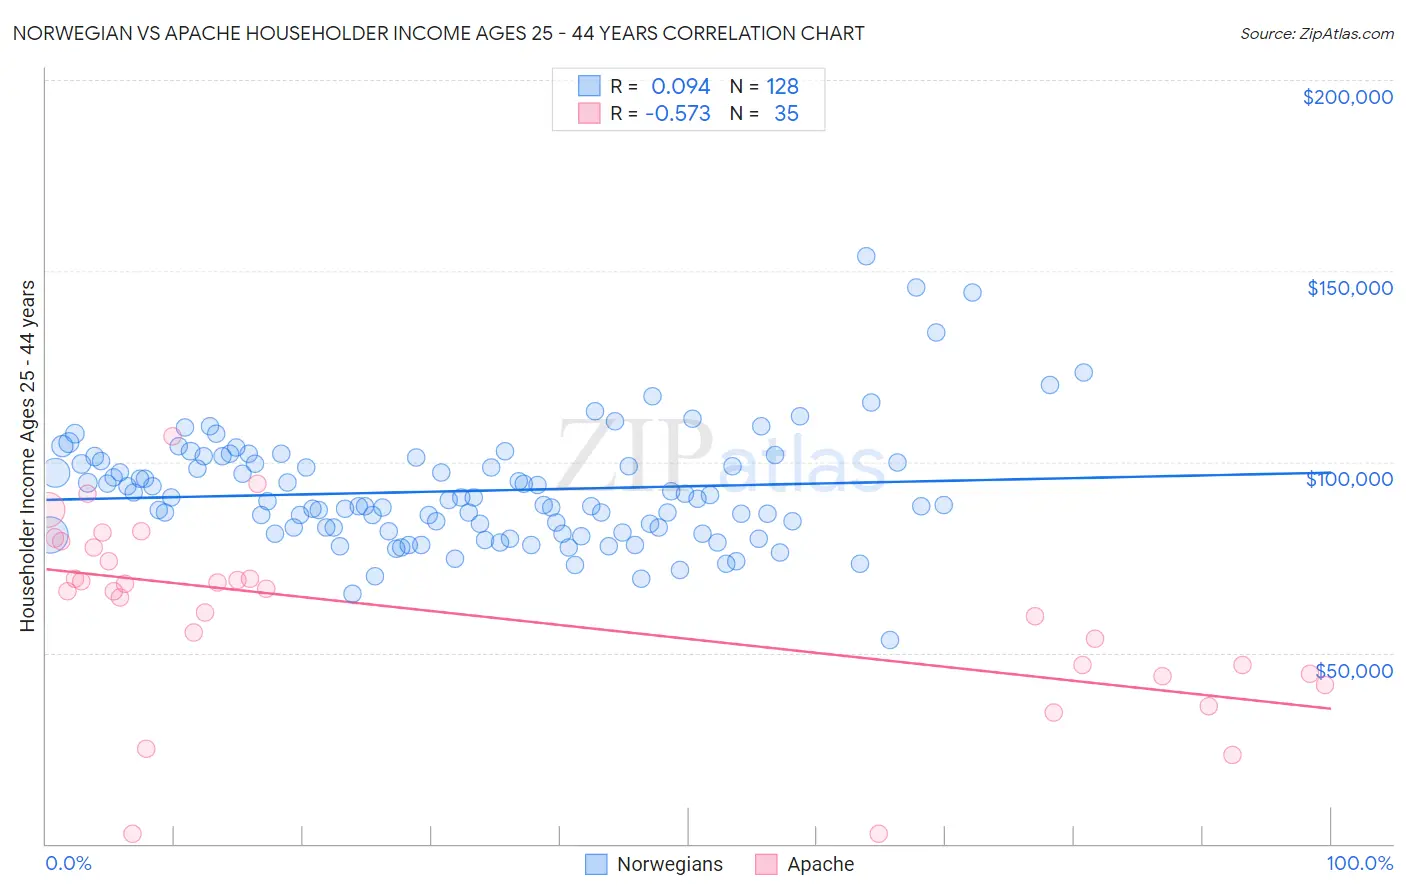
Norwegian vs Apache Householder Income Ages 25 - 44 years Correlation Chart
The statistical analysis conducted on geographies consisting of 529,618,426 people shows a slight positive correlation between the proportion of Norwegians and household income with householder between the ages 25 and 44 in the United States with a correlation coefficient (R) of 0.094 and weighted average of $96,866. Similarly, the statistical analysis conducted on geographies consisting of 230,671,179 people shows a substantial negative correlation between the proportion of Apache and household income with householder between the ages 25 and 44 in the United States with a correlation coefficient (R) of -0.573 and weighted average of $80,260, a difference of 20.7%.
Householder Income Ages 25 - 44 years Correlation Summary
| Measurement | Norwegian | Apache |
| Minimum | $53,269 | $2,499 |
| Maximum | $153,750 | $106,561 |
| Range | $100,481 | $104,062 |
| Mean | $92,386 | $60,213 |
| Median | $89,798 | $66,174 |
| Interquartile 25% (IQ1) | $82,344 | $44,643 |
| Interquartile 75% (IQ3) | $100,008 | $77,529 |
| Interquartile Range (IQR) | $17,664 | $32,886 |
| Standard Deviation (Sample) | $15,216 | $24,023 |
| Standard Deviation (Population) | $15,156 | $23,677 |
Similar Demographics by Householder Income Ages 25 - 44 years
Demographics Similar to Norwegians by Householder Income Ages 25 - 44 years
In terms of householder income ages 25 - 44 years, the demographic groups most similar to Norwegians are Ethiopian ($96,824, a difference of 0.040%), Immigrants from Syria ($96,789, a difference of 0.080%), Irish ($96,730, a difference of 0.14%), Basque ($96,709, a difference of 0.16%), and Ugandan ($96,667, a difference of 0.21%).
| Demographics | Rating | Rank | Householder Income Ages 25 - 44 years |
| Arabs | 82.3 /100 | #138 | Excellent $97,336 |
| Immigrants | Peru | 82.2 /100 | #139 | Excellent $97,329 |
| Immigrants | Morocco | 82.0 /100 | #140 | Excellent $97,305 |
| Luxembourgers | 81.5 /100 | #141 | Excellent $97,237 |
| Danes | 81.3 /100 | #142 | Excellent $97,221 |
| Immigrants | Jordan | 81.0 /100 | #143 | Excellent $97,185 |
| Immigrants | Chile | 80.8 /100 | #144 | Excellent $97,159 |
| Norwegians | 78.2 /100 | #145 | Good $96,866 |
| Ethiopians | 77.8 /100 | #146 | Good $96,824 |
| Immigrants | Syria | 77.4 /100 | #147 | Good $96,789 |
| Irish | 76.9 /100 | #148 | Good $96,730 |
| Basques | 76.6 /100 | #149 | Good $96,709 |
| Ugandans | 76.2 /100 | #150 | Good $96,667 |
| Czechs | 74.8 /100 | #151 | Good $96,525 |
| South American Indians | 74.5 /100 | #152 | Good $96,497 |
Demographics Similar to Apache by Householder Income Ages 25 - 44 years
In terms of householder income ages 25 - 44 years, the demographic groups most similar to Apache are Immigrants from Dominican Republic ($80,319, a difference of 0.070%), Immigrants from Caribbean ($80,326, a difference of 0.080%), Mexican ($80,427, a difference of 0.21%), Haitian ($80,055, a difference of 0.26%), and Immigrants from Central America ($80,012, a difference of 0.31%).
| Demographics | Rating | Rank | Householder Income Ages 25 - 44 years |
| Immigrants | Liberia | 0.1 /100 | #299 | Tragic $80,863 |
| Cherokee | 0.0 /100 | #300 | Tragic $80,843 |
| Immigrants | Micronesia | 0.0 /100 | #301 | Tragic $80,544 |
| Hispanics or Latinos | 0.0 /100 | #302 | Tragic $80,515 |
| Mexicans | 0.0 /100 | #303 | Tragic $80,427 |
| Immigrants | Caribbean | 0.0 /100 | #304 | Tragic $80,326 |
| Immigrants | Dominican Republic | 0.0 /100 | #305 | Tragic $80,319 |
| Apache | 0.0 /100 | #306 | Tragic $80,260 |
| Haitians | 0.0 /100 | #307 | Tragic $80,055 |
| Immigrants | Central America | 0.0 /100 | #308 | Tragic $80,012 |
| Chippewa | 0.0 /100 | #309 | Tragic $80,005 |
| Fijians | 0.0 /100 | #310 | Tragic $79,956 |
| Indonesians | 0.0 /100 | #311 | Tragic $79,543 |
| Immigrants | Haiti | 0.0 /100 | #312 | Tragic $79,391 |
| Menominee | 0.0 /100 | #313 | Tragic $79,358 |