Northern European vs Immigrants from Afghanistan Householder Income Under 25 years
COMPARE
Northern European
Immigrants from Afghanistan
Householder Income Under 25 years
Householder Income Under 25 years Comparison
Northern Europeans
Immigrants from Afghanistan
$51,678
HOUSEHOLDER INCOME UNDER 25 YEARS
22.2/ 100
METRIC RATING
188th/ 347
METRIC RANK
$57,478
HOUSEHOLDER INCOME UNDER 25 YEARS
100.0/ 100
METRIC RATING
16th/ 347
METRIC RANK
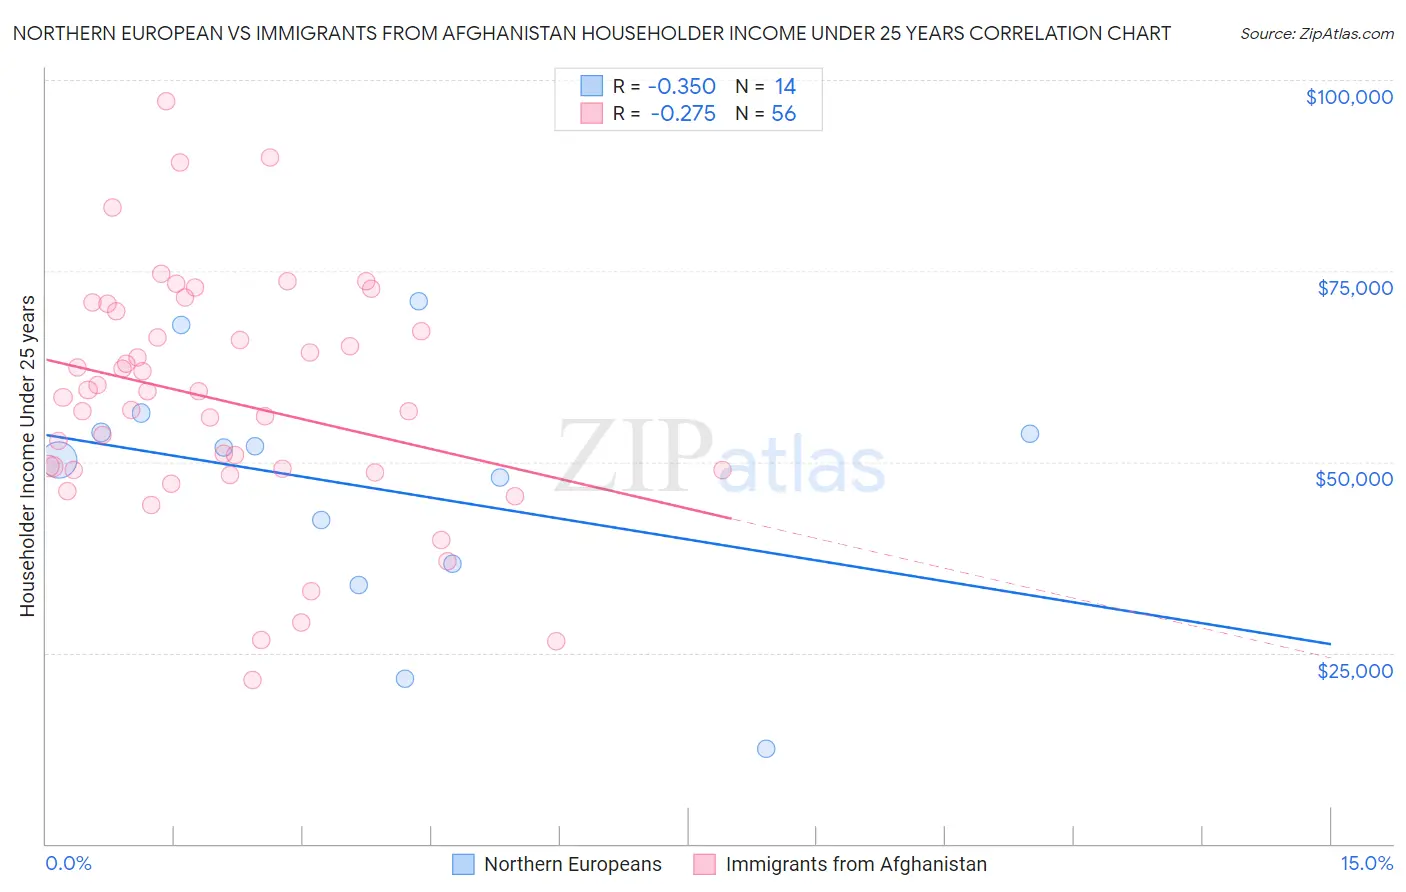
Northern European vs Immigrants from Afghanistan Householder Income Under 25 years Correlation Chart
The statistical analysis conducted on geographies consisting of 340,537,384 people shows a mild negative correlation between the proportion of Northern Europeans and household income with householder under the age of 25 in the United States with a correlation coefficient (R) of -0.350 and weighted average of $51,678. Similarly, the statistical analysis conducted on geographies consisting of 135,231,575 people shows a weak negative correlation between the proportion of Immigrants from Afghanistan and household income with householder under the age of 25 in the United States with a correlation coefficient (R) of -0.275 and weighted average of $57,478, a difference of 11.2%.
Householder Income Under 25 years Correlation Summary
| Measurement | Northern European | Immigrants from Afghanistan |
| Minimum | $12,500 | $21,359 |
| Maximum | $71,017 | $97,219 |
| Range | $58,517 | $75,860 |
| Mean | $46,566 | $58,040 |
| Median | $51,044 | $58,817 |
| Interquartile 25% (IQ1) | $36,723 | $48,980 |
| Interquartile 75% (IQ3) | $53,780 | $68,376 |
| Interquartile Range (IQR) | $17,057 | $19,397 |
| Standard Deviation (Sample) | $16,138 | $15,706 |
| Standard Deviation (Population) | $15,551 | $15,565 |
Similar Demographics by Householder Income Under 25 years
Demographics Similar to Northern Europeans by Householder Income Under 25 years
In terms of householder income under 25 years, the demographic groups most similar to Northern Europeans are Croatian ($51,662, a difference of 0.030%), Immigrants from South Africa ($51,705, a difference of 0.050%), Alaskan Athabascan ($51,713, a difference of 0.070%), Immigrants from Latvia ($51,737, a difference of 0.11%), and Malaysian ($51,615, a difference of 0.12%).
| Demographics | Rating | Rank | Householder Income Under 25 years |
| Europeans | 27.6 /100 | #181 | Fair $51,796 |
| Jordanians | 27.6 /100 | #182 | Fair $51,796 |
| Mexican American Indians | 27.0 /100 | #183 | Fair $51,783 |
| Paiute | 25.1 /100 | #184 | Fair $51,743 |
| Immigrants | Latvia | 24.8 /100 | #185 | Fair $51,737 |
| Alaskan Athabascans | 23.8 /100 | #186 | Fair $51,713 |
| Immigrants | South Africa | 23.4 /100 | #187 | Fair $51,705 |
| Northern Europeans | 22.2 /100 | #188 | Fair $51,678 |
| Croatians | 21.6 /100 | #189 | Fair $51,662 |
| Malaysians | 19.7 /100 | #190 | Poor $51,615 |
| Panamanians | 19.5 /100 | #191 | Poor $51,611 |
| West Indians | 18.5 /100 | #192 | Poor $51,583 |
| Immigrants | Eritrea | 18.1 /100 | #193 | Poor $51,574 |
| Guatemalans | 16.4 /100 | #194 | Poor $51,525 |
| Estonians | 16.4 /100 | #195 | Poor $51,523 |
Demographics Similar to Immigrants from Afghanistan by Householder Income Under 25 years
In terms of householder income under 25 years, the demographic groups most similar to Immigrants from Afghanistan are Sierra Leonean ($57,272, a difference of 0.36%), Korean ($57,730, a difference of 0.44%), Filipino ($57,740, a difference of 0.46%), Immigrants from South Central Asia ($57,818, a difference of 0.59%), and Immigrants from Eastern Asia ($57,123, a difference of 0.62%).
| Demographics | Rating | Rank | Householder Income Under 25 years |
| Chinese | 100.0 /100 | #9 | Exceptional $58,162 |
| Afghans | 100.0 /100 | #10 | Exceptional $58,019 |
| Immigrants | China | 100.0 /100 | #11 | Exceptional $57,931 |
| Immigrants | Philippines | 100.0 /100 | #12 | Exceptional $57,930 |
| Immigrants | South Central Asia | 100.0 /100 | #13 | Exceptional $57,818 |
| Filipinos | 100.0 /100 | #14 | Exceptional $57,740 |
| Koreans | 100.0 /100 | #15 | Exceptional $57,730 |
| Immigrants | Afghanistan | 100.0 /100 | #16 | Exceptional $57,478 |
| Sierra Leoneans | 100.0 /100 | #17 | Exceptional $57,272 |
| Immigrants | Eastern Asia | 100.0 /100 | #18 | Exceptional $57,123 |
| Bhutanese | 100.0 /100 | #19 | Exceptional $57,078 |
| Immigrants | Ireland | 100.0 /100 | #20 | Exceptional $57,075 |
| Immigrants | Fiji | 100.0 /100 | #21 | Exceptional $57,074 |
| Asians | 100.0 /100 | #22 | Exceptional $57,003 |
| Tongans | 100.0 /100 | #23 | Exceptional $56,972 |