Nonimmigrants vs Immigrants from Barbados Per Capita Income
COMPARE
Nonimmigrants
Immigrants from Barbados
Per Capita Income
Per Capita Income Comparison
Nonimmigrants
Immigrants from Barbados
$40,669
PER CAPITA INCOME
3.4/ 100
METRIC RATING
236th/ 347
METRIC RANK
$41,478
PER CAPITA INCOME
7.9/ 100
METRIC RATING
220th/ 347
METRIC RANK
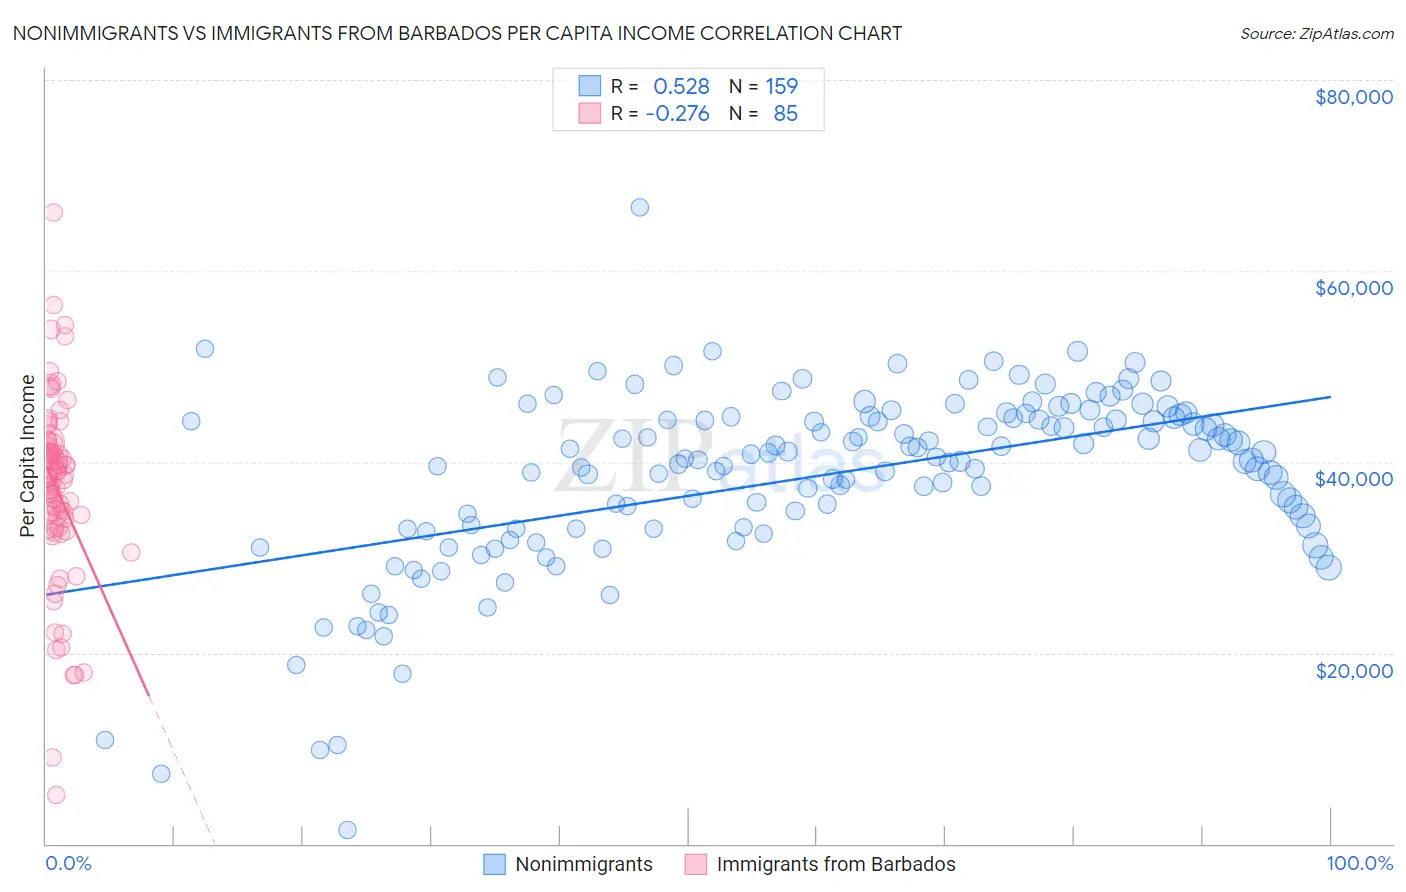
Nonimmigrants vs Immigrants from Barbados Per Capita Income Correlation Chart
The statistical analysis conducted on geographies consisting of 585,383,873 people shows a substantial positive correlation between the proportion of Nonimmigrants and per capita income in the United States with a correlation coefficient (R) of 0.528 and weighted average of $40,669. Similarly, the statistical analysis conducted on geographies consisting of 112,709,172 people shows a weak negative correlation between the proportion of Immigrants from Barbados and per capita income in the United States with a correlation coefficient (R) of -0.276 and weighted average of $41,478, a difference of 2.0%.
Per Capita Income Correlation Summary
| Measurement | Nonimmigrants | Immigrants from Barbados |
| Minimum | $1,397 | $5,075 |
| Maximum | $66,659 | $66,187 |
| Range | $65,262 | $61,112 |
| Mean | $38,443 | $37,004 |
| Median | $40,388 | $38,335 |
| Interquartile 25% (IQ1) | $33,053 | $33,039 |
| Interquartile 75% (IQ3) | $44,574 | $41,445 |
| Interquartile Range (IQR) | $11,521 | $8,406 |
| Standard Deviation (Sample) | $9,433 | $9,798 |
| Standard Deviation (Population) | $9,403 | $9,740 |
Demographics Similar to Nonimmigrants and Immigrants from Barbados by Per Capita Income
In terms of per capita income, the demographic groups most similar to Nonimmigrants are Immigrants from Guyana ($40,742, a difference of 0.18%), Immigrants from West Indies ($40,763, a difference of 0.23%), Delaware ($40,778, a difference of 0.27%), Immigrants from Cambodia ($40,434, a difference of 0.58%), and Guyanese ($40,949, a difference of 0.69%). Similarly, the demographic groups most similar to Immigrants from Barbados are Immigrants from Trinidad and Tobago ($41,476, a difference of 0.0%), Puget Sound Salish ($41,495, a difference of 0.040%), Immigrants from Iraq ($41,365, a difference of 0.27%), Immigrants from Cameroon ($41,334, a difference of 0.35%), and Trinidadian and Tobagonian ($41,655, a difference of 0.43%).
| Demographics | Rating | Rank | Per Capita Income |
| Trinidadians and Tobagonians | 9.5 /100 | #218 | Tragic $41,655 |
| Puget Sound Salish | 8.1 /100 | #219 | Tragic $41,495 |
| Immigrants | Barbados | 7.9 /100 | #220 | Tragic $41,478 |
| Immigrants | Trinidad and Tobago | 7.9 /100 | #221 | Tragic $41,476 |
| Immigrants | Iraq | 7.1 /100 | #222 | Tragic $41,365 |
| Immigrants | Cameroon | 6.8 /100 | #223 | Tragic $41,334 |
| Immigrants | St. Vincent and the Grenadines | 6.4 /100 | #224 | Tragic $41,270 |
| West Indians | 6.0 /100 | #225 | Tragic $41,217 |
| Immigrants | Ecuador | 5.9 /100 | #226 | Tragic $41,195 |
| Immigrants | Ghana | 5.5 /100 | #227 | Tragic $41,131 |
| Immigrants | Grenada | 5.5 /100 | #228 | Tragic $41,123 |
| Nigerians | 4.9 /100 | #229 | Tragic $41,026 |
| Native Hawaiians | 4.9 /100 | #230 | Tragic $41,017 |
| Senegalese | 4.8 /100 | #231 | Tragic $41,000 |
| Guyanese | 4.5 /100 | #232 | Tragic $40,949 |
| Delaware | 3.8 /100 | #233 | Tragic $40,778 |
| Immigrants | West Indies | 3.7 /100 | #234 | Tragic $40,763 |
| Immigrants | Guyana | 3.6 /100 | #235 | Tragic $40,742 |
| Immigrants | Nonimmigrants | 3.4 /100 | #236 | Tragic $40,669 |
| Immigrants | Cambodia | 2.6 /100 | #237 | Tragic $40,434 |
| Somalis | 2.4 /100 | #238 | Tragic $40,367 |