Nonimmigrants vs Belgian Householder Income Under 25 years
COMPARE
Nonimmigrants
Belgian
Householder Income Under 25 years
Householder Income Under 25 years Comparison
Nonimmigrants
Belgians
$49,348
HOUSEHOLDER INCOME UNDER 25 YEARS
0.1/ 100
METRIC RATING
281st/ 347
METRIC RANK
$50,113
HOUSEHOLDER INCOME UNDER 25 YEARS
0.6/ 100
METRIC RATING
265th/ 347
METRIC RANK
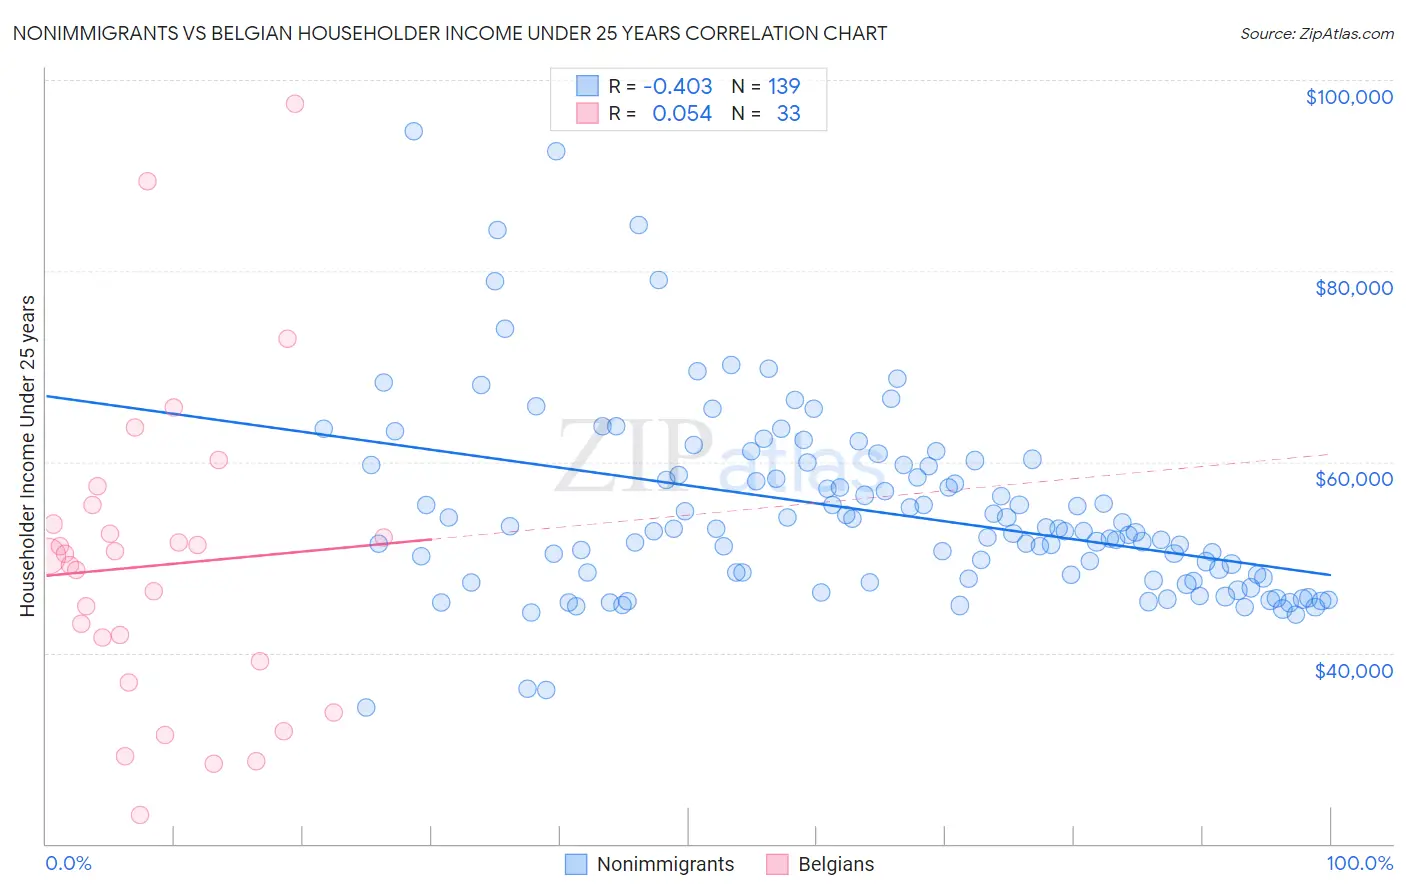
Nonimmigrants vs Belgian Householder Income Under 25 years Correlation Chart
The statistical analysis conducted on geographies consisting of 441,912,887 people shows a moderate negative correlation between the proportion of Nonimmigrants and household income with householder under the age of 25 in the United States with a correlation coefficient (R) of -0.403 and weighted average of $49,348. Similarly, the statistical analysis conducted on geographies consisting of 302,930,390 people shows a slight positive correlation between the proportion of Belgians and household income with householder under the age of 25 in the United States with a correlation coefficient (R) of 0.054 and weighted average of $50,113, a difference of 1.5%.
Householder Income Under 25 years Correlation Summary
| Measurement | Nonimmigrants | Belgian |
| Minimum | $34,271 | $22,948 |
| Maximum | $94,688 | $97,500 |
| Range | $60,417 | $74,552 |
| Mean | $54,795 | $49,189 |
| Median | $52,736 | $50,156 |
| Interquartile 25% (IQ1) | $47,750 | $38,023 |
| Interquartile 75% (IQ3) | $59,631 | $54,461 |
| Interquartile Range (IQR) | $11,881 | $16,438 |
| Standard Deviation (Sample) | $9,929 | $16,294 |
| Standard Deviation (Population) | $9,893 | $16,045 |
Demographics Similar to Nonimmigrants and Belgians by Householder Income Under 25 years
In terms of householder income under 25 years, the demographic groups most similar to Nonimmigrants are Hmong ($49,364, a difference of 0.030%), Apache ($49,395, a difference of 0.090%), Nigerian ($49,416, a difference of 0.14%), Alsatian ($49,267, a difference of 0.16%), and Immigrants from Nigeria ($49,174, a difference of 0.35%). Similarly, the demographic groups most similar to Belgians are Immigrants from Venezuela ($50,109, a difference of 0.010%), Fijian ($50,132, a difference of 0.040%), Immigrants from Laos ($50,041, a difference of 0.14%), Immigrants from Dominican Republic ($50,204, a difference of 0.18%), and Venezuelan ($50,011, a difference of 0.20%).
| Demographics | Rating | Rank | Householder Income Under 25 years |
| Immigrants | Dominican Republic | 0.8 /100 | #263 | Tragic $50,204 |
| Fijians | 0.6 /100 | #264 | Tragic $50,132 |
| Belgians | 0.6 /100 | #265 | Tragic $50,113 |
| Immigrants | Venezuela | 0.6 /100 | #266 | Tragic $50,109 |
| Immigrants | Laos | 0.5 /100 | #267 | Tragic $50,041 |
| Venezuelans | 0.5 /100 | #268 | Tragic $50,011 |
| Ute | 0.5 /100 | #269 | Tragic $49,997 |
| Mexicans | 0.5 /100 | #270 | Tragic $49,989 |
| Taiwanese | 0.3 /100 | #271 | Tragic $49,804 |
| Colville | 0.3 /100 | #272 | Tragic $49,774 |
| Slovaks | 0.3 /100 | #273 | Tragic $49,753 |
| Immigrants | Senegal | 0.3 /100 | #274 | Tragic $49,742 |
| Immigrants | Kenya | 0.2 /100 | #275 | Tragic $49,633 |
| Dominicans | 0.2 /100 | #276 | Tragic $49,633 |
| Immigrants | Western Africa | 0.2 /100 | #277 | Tragic $49,621 |
| Nigerians | 0.1 /100 | #278 | Tragic $49,416 |
| Apache | 0.1 /100 | #279 | Tragic $49,395 |
| Hmong | 0.1 /100 | #280 | Tragic $49,364 |
| Immigrants | Nonimmigrants | 0.1 /100 | #281 | Tragic $49,348 |
| Alsatians | 0.1 /100 | #282 | Tragic $49,267 |
| Immigrants | Nigeria | 0.1 /100 | #283 | Tragic $49,174 |