Nigerian vs Pueblo Median Male Earnings
COMPARE
Nigerian
Pueblo
Median Male Earnings
Median Male Earnings Comparison
Nigerians
Pueblo
$52,039
MEDIAN MALE EARNINGS
8.3/ 100
METRIC RATING
217th/ 347
METRIC RANK
$41,314
MEDIAN MALE EARNINGS
0.0/ 100
METRIC RATING
344th/ 347
METRIC RANK
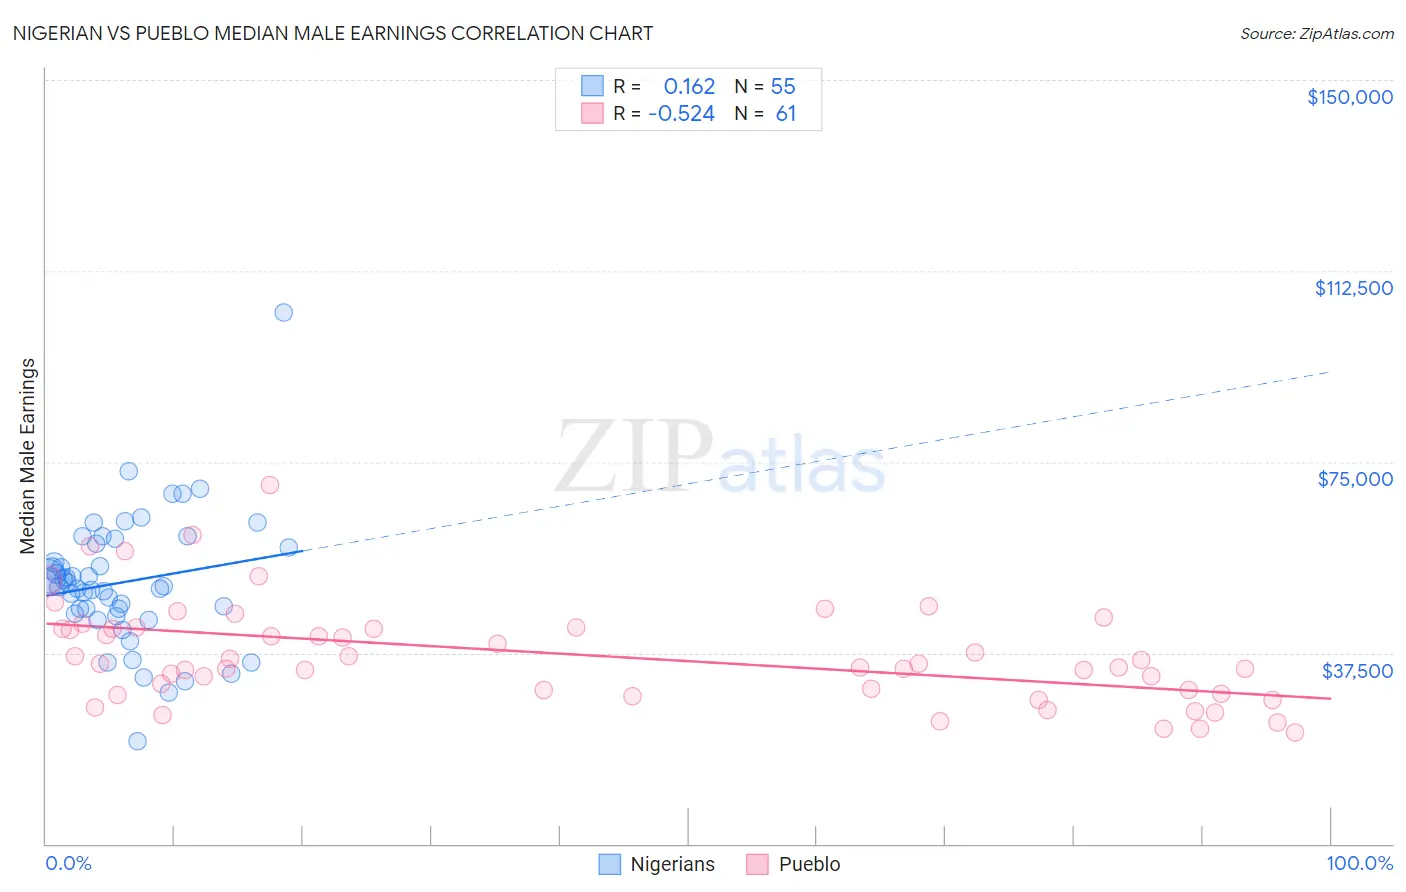
Nigerian vs Pueblo Median Male Earnings Correlation Chart
The statistical analysis conducted on geographies consisting of 332,727,024 people shows a poor positive correlation between the proportion of Nigerians and median male earnings in the United States with a correlation coefficient (R) of 0.162 and weighted average of $52,039. Similarly, the statistical analysis conducted on geographies consisting of 120,058,056 people shows a substantial negative correlation between the proportion of Pueblo and median male earnings in the United States with a correlation coefficient (R) of -0.524 and weighted average of $41,314, a difference of 26.0%.
Median Male Earnings Correlation Summary
| Measurement | Nigerian | Pueblo |
| Minimum | $20,187 | $21,750 |
| Maximum | $104,375 | $70,357 |
| Range | $84,188 | $48,607 |
| Mean | $51,399 | $37,142 |
| Median | $50,552 | $35,266 |
| Interquartile 25% (IQ1) | $45,099 | $29,777 |
| Interquartile 75% (IQ3) | $58,900 | $42,334 |
| Interquartile Range (IQR) | $13,801 | $12,557 |
| Standard Deviation (Sample) | $12,955 | $9,968 |
| Standard Deviation (Population) | $12,837 | $9,886 |
Similar Demographics by Median Male Earnings
Demographics Similar to Nigerians by Median Male Earnings
In terms of median male earnings, the demographic groups most similar to Nigerians are Immigrants from Venezuela ($52,041, a difference of 0.0%), Immigrants from Cameroon ($52,119, a difference of 0.15%), Immigrants from Panama ($51,962, a difference of 0.15%), Nonimmigrants ($52,170, a difference of 0.25%), and Immigrants from Ghana ($51,836, a difference of 0.39%).
| Demographics | Rating | Rank | Median Male Earnings |
| Delaware | 11.5 /100 | #210 | Poor $52,412 |
| Tlingit-Haida | 11.5 /100 | #211 | Poor $52,409 |
| Cajuns | 10.7 /100 | #212 | Poor $52,325 |
| Native Hawaiians | 10.5 /100 | #213 | Poor $52,306 |
| Immigrants | Nonimmigrants | 9.3 /100 | #214 | Tragic $52,170 |
| Immigrants | Cameroon | 8.9 /100 | #215 | Tragic $52,119 |
| Immigrants | Venezuela | 8.3 /100 | #216 | Tragic $52,041 |
| Nigerians | 8.3 /100 | #217 | Tragic $52,039 |
| Immigrants | Panama | 7.7 /100 | #218 | Tragic $51,962 |
| Immigrants | Ghana | 6.9 /100 | #219 | Tragic $51,836 |
| Immigrants | Armenia | 6.6 /100 | #220 | Tragic $51,793 |
| Immigrants | Senegal | 5.8 /100 | #221 | Tragic $51,647 |
| Immigrants | Bangladesh | 5.8 /100 | #222 | Tragic $51,642 |
| Ecuadorians | 5.5 /100 | #223 | Tragic $51,596 |
| Immigrants | Cambodia | 5.5 /100 | #224 | Tragic $51,594 |
Demographics Similar to Pueblo by Median Male Earnings
In terms of median male earnings, the demographic groups most similar to Pueblo are Lumbee ($41,715, a difference of 0.97%), Arapaho ($41,758, a difference of 1.1%), Hopi ($42,060, a difference of 1.8%), Navajo ($42,098, a difference of 1.9%), and Pima ($42,357, a difference of 2.5%).
| Demographics | Rating | Rank | Median Male Earnings |
| Immigrants | Congo | 0.0 /100 | #333 | Tragic $44,204 |
| Immigrants | Yemen | 0.0 /100 | #334 | Tragic $44,083 |
| Spanish American Indians | 0.0 /100 | #335 | Tragic $44,010 |
| Immigrants | Cuba | 0.0 /100 | #336 | Tragic $43,461 |
| Menominee | 0.0 /100 | #337 | Tragic $42,581 |
| Crow | 0.0 /100 | #338 | Tragic $42,434 |
| Pima | 0.0 /100 | #339 | Tragic $42,357 |
| Navajo | 0.0 /100 | #340 | Tragic $42,098 |
| Hopi | 0.0 /100 | #341 | Tragic $42,060 |
| Arapaho | 0.0 /100 | #342 | Tragic $41,758 |
| Lumbee | 0.0 /100 | #343 | Tragic $41,715 |
| Pueblo | 0.0 /100 | #344 | Tragic $41,314 |
| Puerto Ricans | 0.0 /100 | #345 | Tragic $40,071 |
| Tohono O'odham | 0.0 /100 | #346 | Tragic $39,543 |
| Yup'ik | 0.0 /100 | #347 | Tragic $39,504 |