Nigerian vs Norwegian Householder Income Under 25 years
COMPARE
Nigerian
Norwegian
Householder Income Under 25 years
Householder Income Under 25 years Comparison
Nigerians
Norwegians
$49,416
HOUSEHOLDER INCOME UNDER 25 YEARS
0.1/ 100
METRIC RATING
278th/ 347
METRIC RANK
$53,127
HOUSEHOLDER INCOME UNDER 25 YEARS
90.8/ 100
METRIC RATING
138th/ 347
METRIC RANK
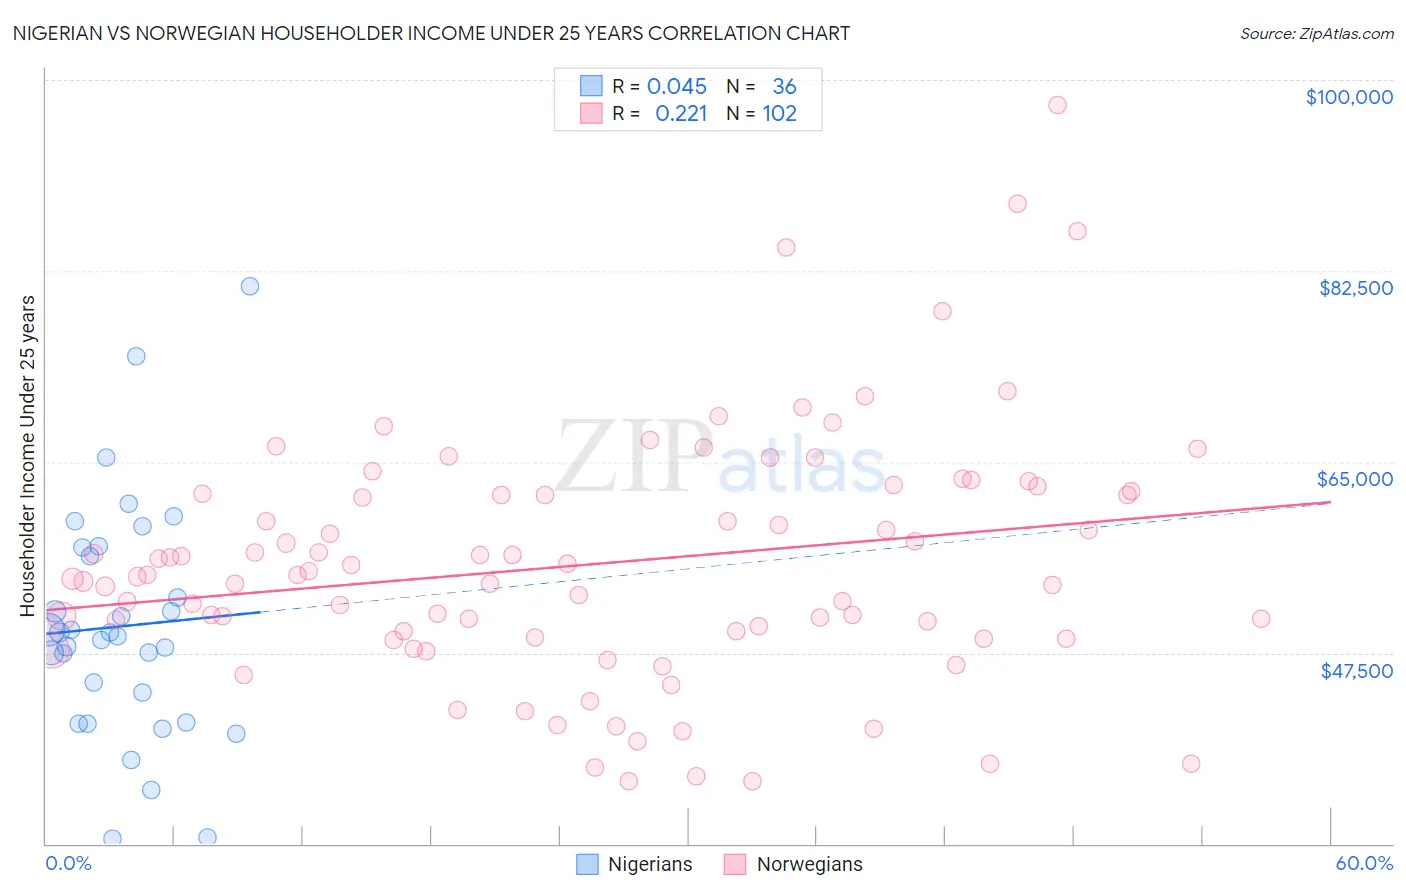
Nigerian vs Norwegian Householder Income Under 25 years Correlation Chart
The statistical analysis conducted on geographies consisting of 292,788,883 people shows no correlation between the proportion of Nigerians and household income with householder under the age of 25 in the United States with a correlation coefficient (R) of 0.045 and weighted average of $49,416. Similarly, the statistical analysis conducted on geographies consisting of 421,100,375 people shows a weak positive correlation between the proportion of Norwegians and household income with householder under the age of 25 in the United States with a correlation coefficient (R) of 0.221 and weighted average of $53,127, a difference of 7.5%.
Householder Income Under 25 years Correlation Summary
| Measurement | Nigerian | Norwegian |
| Minimum | $30,457 | $35,753 |
| Maximum | $81,073 | $97,750 |
| Range | $50,616 | $61,997 |
| Mean | $49,943 | $55,657 |
| Median | $49,233 | $54,551 |
| Interquartile 25% (IQ1) | $42,438 | $48,924 |
| Interquartile 75% (IQ3) | $56,752 | $62,074 |
| Interquartile Range (IQR) | $14,314 | $13,150 |
| Standard Deviation (Sample) | $10,734 | $11,328 |
| Standard Deviation (Population) | $10,584 | $11,273 |
Similar Demographics by Householder Income Under 25 years
Demographics Similar to Nigerians by Householder Income Under 25 years
In terms of householder income under 25 years, the demographic groups most similar to Nigerians are Apache ($49,395, a difference of 0.040%), Hmong ($49,364, a difference of 0.11%), Nonimmigrants ($49,348, a difference of 0.14%), Alsatian ($49,267, a difference of 0.30%), and Immigrants from Western Africa ($49,621, a difference of 0.41%).
| Demographics | Rating | Rank | Householder Income Under 25 years |
| Taiwanese | 0.3 /100 | #271 | Tragic $49,804 |
| Colville | 0.3 /100 | #272 | Tragic $49,774 |
| Slovaks | 0.3 /100 | #273 | Tragic $49,753 |
| Immigrants | Senegal | 0.3 /100 | #274 | Tragic $49,742 |
| Immigrants | Kenya | 0.2 /100 | #275 | Tragic $49,633 |
| Dominicans | 0.2 /100 | #276 | Tragic $49,633 |
| Immigrants | Western Africa | 0.2 /100 | #277 | Tragic $49,621 |
| Nigerians | 0.1 /100 | #278 | Tragic $49,416 |
| Apache | 0.1 /100 | #279 | Tragic $49,395 |
| Hmong | 0.1 /100 | #280 | Tragic $49,364 |
| Immigrants | Nonimmigrants | 0.1 /100 | #281 | Tragic $49,348 |
| Alsatians | 0.1 /100 | #282 | Tragic $49,267 |
| Immigrants | Nigeria | 0.1 /100 | #283 | Tragic $49,174 |
| Carpatho Rusyns | 0.1 /100 | #284 | Tragic $49,113 |
| Scotch-Irish | 0.0 /100 | #285 | Tragic $49,039 |
Demographics Similar to Norwegians by Householder Income Under 25 years
In terms of householder income under 25 years, the demographic groups most similar to Norwegians are Costa Rican ($53,106, a difference of 0.040%), Immigrants from Barbados ($53,163, a difference of 0.070%), Hawaiian ($53,078, a difference of 0.090%), Armenian ($53,179, a difference of 0.10%), and Immigrants from Northern Africa ($53,185, a difference of 0.11%).
| Demographics | Rating | Rank | Householder Income Under 25 years |
| Immigrants | Nicaragua | 93.3 /100 | #131 | Exceptional $53,266 |
| Moroccans | 93.1 /100 | #132 | Exceptional $53,256 |
| Immigrants | Immigrants | 92.2 /100 | #133 | Exceptional $53,201 |
| Immigrants | Northern Africa | 91.9 /100 | #134 | Exceptional $53,185 |
| Chileans | 91.9 /100 | #135 | Exceptional $53,185 |
| Armenians | 91.8 /100 | #136 | Exceptional $53,179 |
| Immigrants | Barbados | 91.5 /100 | #137 | Exceptional $53,163 |
| Norwegians | 90.8 /100 | #138 | Exceptional $53,127 |
| Costa Ricans | 90.4 /100 | #139 | Exceptional $53,106 |
| Hawaiians | 89.8 /100 | #140 | Excellent $53,078 |
| Danes | 88.9 /100 | #141 | Excellent $53,041 |
| Immigrants | Armenia | 87.5 /100 | #142 | Excellent $52,986 |
| Swedes | 87.5 /100 | #143 | Excellent $52,986 |
| South American Indians | 87.3 /100 | #144 | Excellent $52,979 |
| Immigrants | Western Europe | 86.7 /100 | #145 | Excellent $52,957 |