Nicaraguan vs Bangladeshi Householder Income Ages 45 - 64 years
COMPARE
Nicaraguan
Bangladeshi
Householder Income Ages 45 - 64 years
Householder Income Ages 45 - 64 years Comparison
Nicaraguans
Bangladeshis
$92,554
HOUSEHOLDER INCOME AGES 45 - 64 YEARS
2.0/ 100
METRIC RATING
235th/ 347
METRIC RANK
$86,402
HOUSEHOLDER INCOME AGES 45 - 64 YEARS
0.1/ 100
METRIC RATING
287th/ 347
METRIC RANK
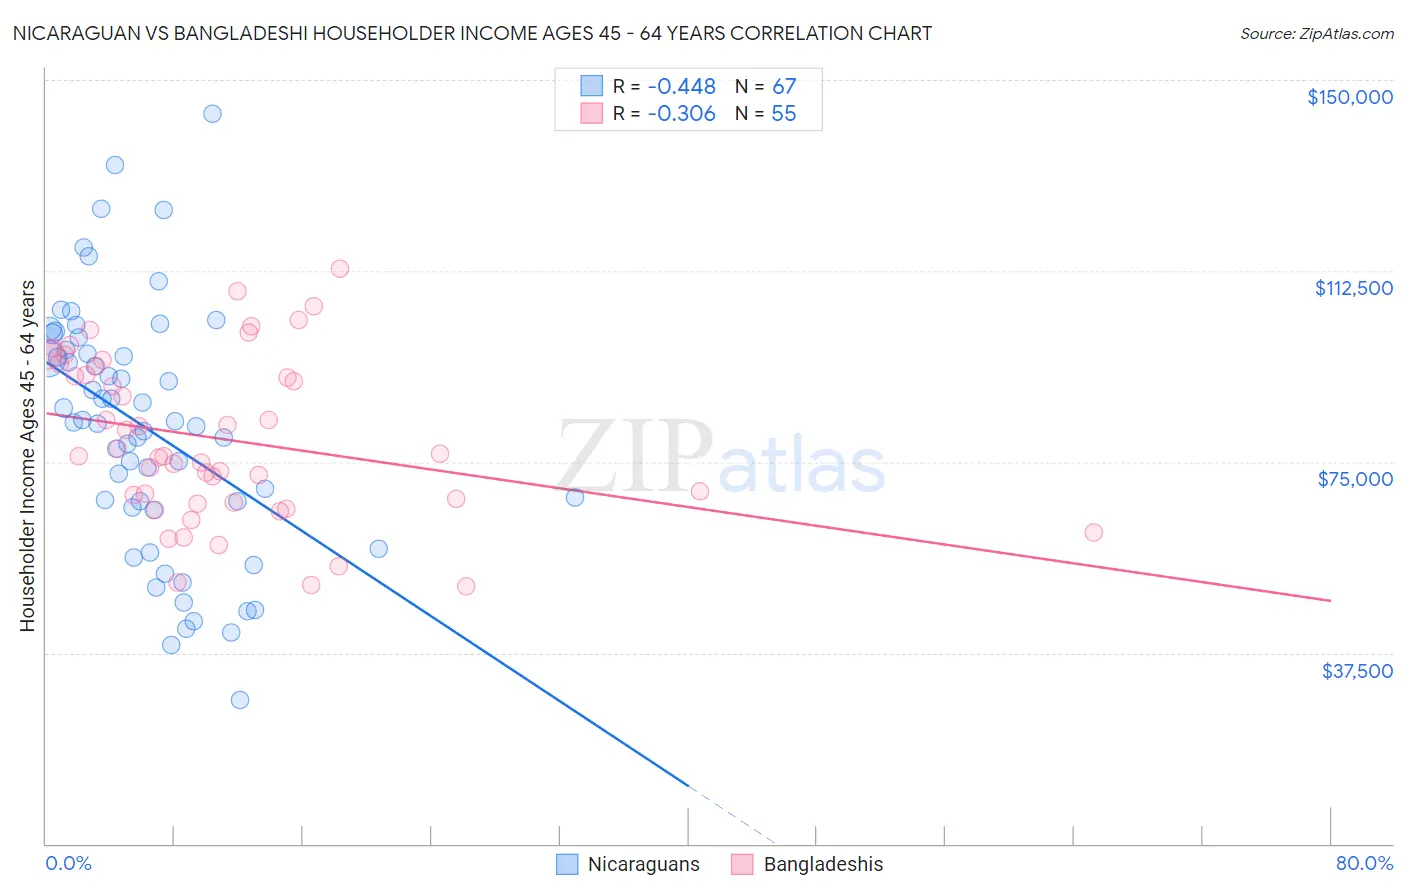
Nicaraguan vs Bangladeshi Householder Income Ages 45 - 64 years Correlation Chart
The statistical analysis conducted on geographies consisting of 285,455,772 people shows a moderate negative correlation between the proportion of Nicaraguans and household income with householder between the ages 45 and 64 in the United States with a correlation coefficient (R) of -0.448 and weighted average of $92,554. Similarly, the statistical analysis conducted on geographies consisting of 141,236,471 people shows a mild negative correlation between the proportion of Bangladeshis and household income with householder between the ages 45 and 64 in the United States with a correlation coefficient (R) of -0.306 and weighted average of $86,402, a difference of 7.1%.
Householder Income Ages 45 - 64 years Correlation Summary
| Measurement | Nicaraguan | Bangladeshi |
| Minimum | $28,333 | $50,598 |
| Maximum | $143,278 | $113,000 |
| Range | $114,945 | $62,402 |
| Mean | $81,452 | $79,486 |
| Median | $82,750 | $76,107 |
| Interquartile 25% (IQ1) | $65,957 | $66,969 |
| Interquartile 75% (IQ3) | $97,029 | $93,746 |
| Interquartile Range (IQR) | $31,072 | $26,777 |
| Standard Deviation (Sample) | $24,263 | $15,976 |
| Standard Deviation (Population) | $24,082 | $15,831 |
Similar Demographics by Householder Income Ages 45 - 64 years
Demographics Similar to Nicaraguans by Householder Income Ages 45 - 64 years
In terms of householder income ages 45 - 64 years, the demographic groups most similar to Nicaraguans are Immigrants from Western Africa ($92,384, a difference of 0.18%), Immigrants from Bangladesh ($92,208, a difference of 0.37%), Pennsylvania German ($91,956, a difference of 0.65%), Immigrants from El Salvador ($93,176, a difference of 0.67%), and Nepalese ($93,355, a difference of 0.87%).
| Demographics | Rating | Rank | Householder Income Ages 45 - 64 years |
| Immigrants | Panama | 3.7 /100 | #228 | Tragic $93,815 |
| Vietnamese | 3.6 /100 | #229 | Tragic $93,788 |
| Immigrants | Sudan | 3.6 /100 | #230 | Tragic $93,781 |
| Ecuadorians | 3.6 /100 | #231 | Tragic $93,739 |
| Sudanese | 3.5 /100 | #232 | Tragic $93,718 |
| Nepalese | 3.0 /100 | #233 | Tragic $93,355 |
| Immigrants | El Salvador | 2.7 /100 | #234 | Tragic $93,176 |
| Nicaraguans | 2.0 /100 | #235 | Tragic $92,554 |
| Immigrants | Western Africa | 1.8 /100 | #236 | Tragic $92,384 |
| Immigrants | Bangladesh | 1.7 /100 | #237 | Tragic $92,208 |
| Pennsylvania Germans | 1.5 /100 | #238 | Tragic $91,956 |
| Immigrants | Ecuador | 1.2 /100 | #239 | Tragic $91,462 |
| Immigrants | Burma/Myanmar | 1.1 /100 | #240 | Tragic $91,385 |
| Trinidadians and Tobagonians | 1.1 /100 | #241 | Tragic $91,357 |
| Inupiat | 1.1 /100 | #242 | Tragic $91,355 |
Demographics Similar to Bangladeshis by Householder Income Ages 45 - 64 years
In terms of householder income ages 45 - 64 years, the demographic groups most similar to Bangladeshis are Immigrants from St. Vincent and the Grenadines ($86,394, a difference of 0.010%), Cuban ($86,301, a difference of 0.12%), Immigrants from Guatemala ($86,573, a difference of 0.20%), Blackfeet ($86,595, a difference of 0.22%), and Cherokee ($86,125, a difference of 0.32%).
| Demographics | Rating | Rank | Householder Income Ages 45 - 64 years |
| Immigrants | Somalia | 0.1 /100 | #280 | Tragic $86,987 |
| Yaqui | 0.1 /100 | #281 | Tragic $86,914 |
| Senegalese | 0.1 /100 | #282 | Tragic $86,897 |
| Mexicans | 0.1 /100 | #283 | Tragic $86,816 |
| Central American Indians | 0.1 /100 | #284 | Tragic $86,764 |
| Blackfeet | 0.1 /100 | #285 | Tragic $86,595 |
| Immigrants | Guatemala | 0.1 /100 | #286 | Tragic $86,573 |
| Bangladeshis | 0.1 /100 | #287 | Tragic $86,402 |
| Immigrants | St. Vincent and the Grenadines | 0.1 /100 | #288 | Tragic $86,394 |
| Cubans | 0.1 /100 | #289 | Tragic $86,301 |
| Cherokee | 0.1 /100 | #290 | Tragic $86,125 |
| Hispanics or Latinos | 0.1 /100 | #291 | Tragic $86,006 |
| Immigrants | Central America | 0.1 /100 | #292 | Tragic $85,965 |
| Comanche | 0.1 /100 | #293 | Tragic $85,787 |
| British West Indians | 0.1 /100 | #294 | Tragic $85,571 |