Nepalese vs Immigrants from Canada Median Earnings
COMPARE
Nepalese
Immigrants from Canada
Median Earnings
Median Earnings Comparison
Nepalese
Immigrants from Canada
$43,860
MEDIAN EARNINGS
2.6/ 100
METRIC RATING
248th/ 347
METRIC RANK
$50,192
MEDIAN EARNINGS
99.5/ 100
METRIC RATING
86th/ 347
METRIC RANK
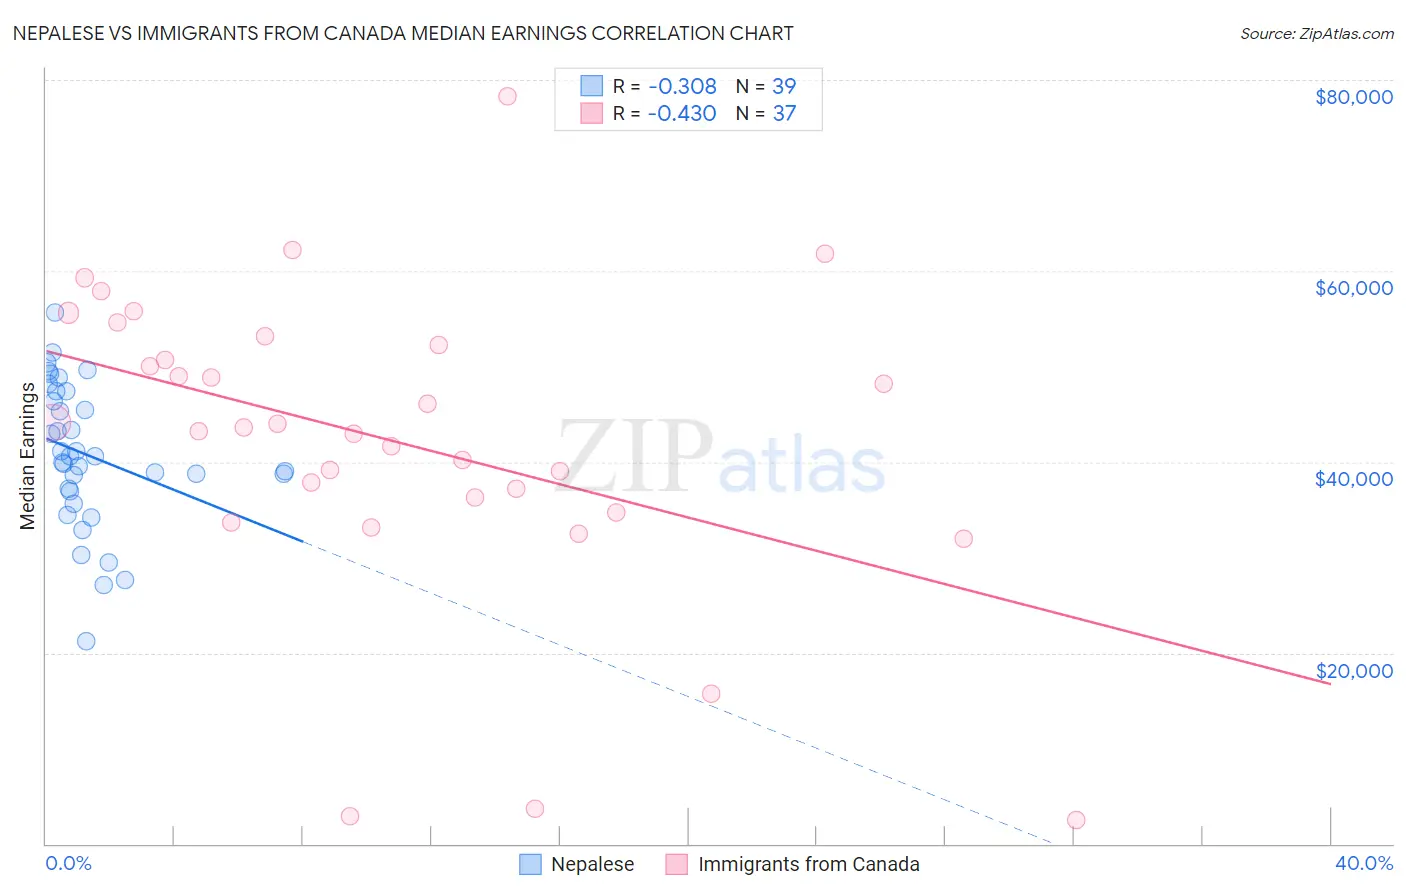
Nepalese vs Immigrants from Canada Median Earnings Correlation Chart
The statistical analysis conducted on geographies consisting of 24,434,314 people shows a mild negative correlation between the proportion of Nepalese and median earnings in the United States with a correlation coefficient (R) of -0.308 and weighted average of $43,860. Similarly, the statistical analysis conducted on geographies consisting of 459,326,577 people shows a moderate negative correlation between the proportion of Immigrants from Canada and median earnings in the United States with a correlation coefficient (R) of -0.430 and weighted average of $50,192, a difference of 14.4%.
Median Earnings Correlation Summary
| Measurement | Nepalese | Immigrants from Canada |
| Minimum | $21,187 | $2,499 |
| Maximum | $55,594 | $78,310 |
| Range | $34,407 | $75,811 |
| Mean | $40,712 | $42,254 |
| Median | $40,613 | $43,536 |
| Interquartile 25% (IQ1) | $36,926 | $35,442 |
| Interquartile 75% (IQ3) | $47,393 | $52,692 |
| Interquartile Range (IQR) | $10,467 | $17,250 |
| Standard Deviation (Sample) | $7,531 | $16,214 |
| Standard Deviation (Population) | $7,434 | $15,993 |
Similar Demographics by Median Earnings
Demographics Similar to Nepalese by Median Earnings
In terms of median earnings, the demographic groups most similar to Nepalese are Malaysian ($43,844, a difference of 0.040%), Immigrants from Cabo Verde ($43,963, a difference of 0.24%), Alaska Native ($43,750, a difference of 0.25%), Immigrants from West Indies ($43,989, a difference of 0.29%), and Immigrants from Burma/Myanmar ($43,998, a difference of 0.31%).
| Demographics | Rating | Rank | Median Earnings |
| Samoans | 4.2 /100 | #241 | Tragic $44,206 |
| Immigrants | Venezuela | 4.0 /100 | #242 | Tragic $44,163 |
| Sub-Saharan Africans | 3.7 /100 | #243 | Tragic $44,118 |
| Immigrants | Nonimmigrants | 3.7 /100 | #244 | Tragic $44,117 |
| Immigrants | Burma/Myanmar | 3.2 /100 | #245 | Tragic $43,998 |
| Immigrants | West Indies | 3.1 /100 | #246 | Tragic $43,989 |
| Immigrants | Cabo Verde | 3.0 /100 | #247 | Tragic $43,963 |
| Nepalese | 2.6 /100 | #248 | Tragic $43,860 |
| Malaysians | 2.6 /100 | #249 | Tragic $43,844 |
| Alaska Natives | 2.3 /100 | #250 | Tragic $43,750 |
| Tsimshian | 2.1 /100 | #251 | Tragic $43,695 |
| Hawaiians | 2.0 /100 | #252 | Tragic $43,673 |
| Somalis | 1.8 /100 | #253 | Tragic $43,567 |
| Liberians | 1.7 /100 | #254 | Tragic $43,536 |
| Immigrants | Middle Africa | 1.4 /100 | #255 | Tragic $43,416 |
Demographics Similar to Immigrants from Canada by Median Earnings
In terms of median earnings, the demographic groups most similar to Immigrants from Canada are Immigrants from Hungary ($50,227, a difference of 0.070%), Immigrants from Kazakhstan ($50,225, a difference of 0.070%), Immigrants from Uzbekistan ($50,151, a difference of 0.080%), Romanian ($50,244, a difference of 0.10%), and Albanian ($50,116, a difference of 0.15%).
| Demographics | Rating | Rank | Median Earnings |
| Laotians | 99.6 /100 | #79 | Exceptional $50,343 |
| Ukrainians | 99.6 /100 | #80 | Exceptional $50,320 |
| Immigrants | Southern Europe | 99.6 /100 | #81 | Exceptional $50,280 |
| Immigrants | Moldova | 99.5 /100 | #82 | Exceptional $50,274 |
| Romanians | 99.5 /100 | #83 | Exceptional $50,244 |
| Immigrants | Hungary | 99.5 /100 | #84 | Exceptional $50,227 |
| Immigrants | Kazakhstan | 99.5 /100 | #85 | Exceptional $50,225 |
| Immigrants | Canada | 99.5 /100 | #86 | Exceptional $50,192 |
| Immigrants | Uzbekistan | 99.5 /100 | #87 | Exceptional $50,151 |
| Albanians | 99.4 /100 | #88 | Exceptional $50,116 |
| Immigrants | North America | 99.4 /100 | #89 | Exceptional $50,108 |
| Italians | 99.3 /100 | #90 | Exceptional $49,915 |
| Macedonians | 99.2 /100 | #91 | Exceptional $49,893 |
| Immigrants | Argentina | 99.2 /100 | #92 | Exceptional $49,841 |
| Armenians | 99.1 /100 | #93 | Exceptional $49,804 |