Navajo vs Scottish Householder Income Under 25 years
COMPARE
Navajo
Scottish
Householder Income Under 25 years
Householder Income Under 25 years Comparison
Navajo
Scottish
$42,380
HOUSEHOLDER INCOME UNDER 25 YEARS
0.0/ 100
METRIC RATING
345th/ 347
METRIC RANK
$50,554
HOUSEHOLDER INCOME UNDER 25 YEARS
1.8/ 100
METRIC RATING
249th/ 347
METRIC RANK
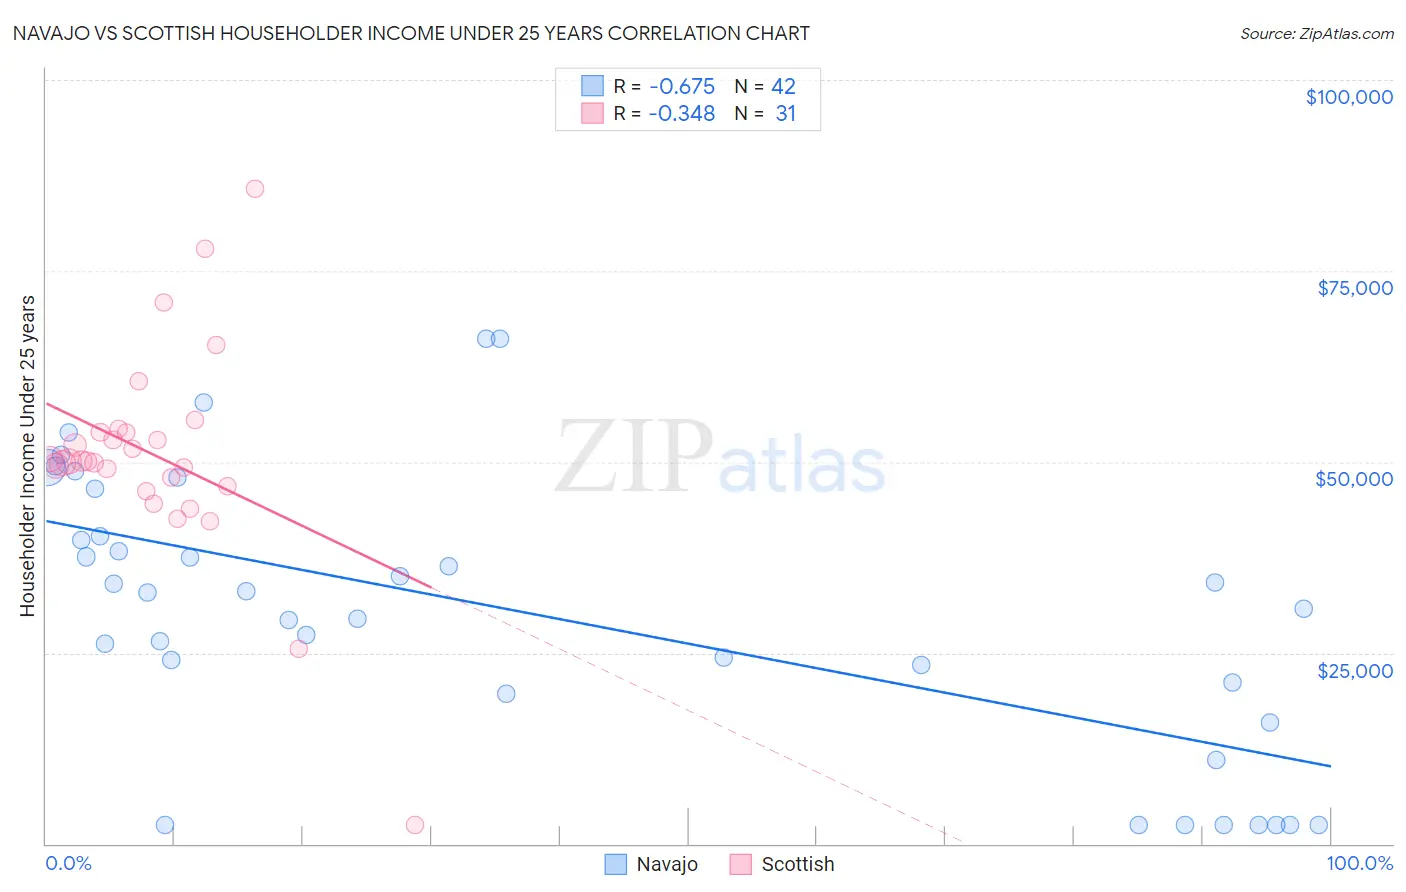
Navajo vs Scottish Householder Income Under 25 years Correlation Chart
The statistical analysis conducted on geographies consisting of 204,469,211 people shows a significant negative correlation between the proportion of Navajo and household income with householder under the age of 25 in the United States with a correlation coefficient (R) of -0.675 and weighted average of $42,380. Similarly, the statistical analysis conducted on geographies consisting of 436,394,283 people shows a mild negative correlation between the proportion of Scottish and household income with householder under the age of 25 in the United States with a correlation coefficient (R) of -0.348 and weighted average of $50,554, a difference of 19.3%.
Householder Income Under 25 years Correlation Summary
| Measurement | Navajo | Scottish |
| Minimum | $2,499 | $2,499 |
| Maximum | $66,100 | $85,781 |
| Range | $63,601 | $83,282 |
| Mean | $30,108 | $50,902 |
| Median | $31,821 | $50,084 |
| Interquartile 25% (IQ1) | $19,702 | $46,875 |
| Interquartile 75% (IQ3) | $40,321 | $53,902 |
| Interquartile Range (IQR) | $20,619 | $7,027 |
| Standard Deviation (Sample) | $18,160 | $14,135 |
| Standard Deviation (Population) | $17,943 | $13,905 |
Similar Demographics by Householder Income Under 25 years
Demographics Similar to Navajo by Householder Income Under 25 years
In terms of householder income under 25 years, the demographic groups most similar to Navajo are Immigrants from Congo ($43,266, a difference of 2.1%), Immigrants from Yemen ($43,591, a difference of 2.9%), Arapaho ($44,003, a difference of 3.8%), Houma ($44,356, a difference of 4.7%), and Black/African American ($44,381, a difference of 4.7%).
| Demographics | Rating | Rank | Householder Income Under 25 years |
| Creek | 0.0 /100 | #333 | Tragic $45,371 |
| Cajuns | 0.0 /100 | #334 | Tragic $45,338 |
| Cheyenne | 0.0 /100 | #335 | Tragic $45,275 |
| Tohono O'odham | 0.0 /100 | #336 | Tragic $45,248 |
| Pueblo | 0.0 /100 | #337 | Tragic $45,018 |
| Chickasaw | 0.0 /100 | #338 | Tragic $44,763 |
| Kiowa | 0.0 /100 | #339 | Tragic $44,733 |
| Blacks/African Americans | 0.0 /100 | #340 | Tragic $44,381 |
| Houma | 0.0 /100 | #341 | Tragic $44,356 |
| Arapaho | 0.0 /100 | #342 | Tragic $44,003 |
| Immigrants | Yemen | 0.0 /100 | #343 | Tragic $43,591 |
| Immigrants | Congo | 0.0 /100 | #344 | Tragic $43,266 |
| Navajo | 0.0 /100 | #345 | Tragic $42,380 |
| Puerto Ricans | 0.0 /100 | #346 | Tragic $39,726 |
| Lumbee | 0.0 /100 | #347 | Tragic $34,584 |
Demographics Similar to Scottish by Householder Income Under 25 years
In terms of householder income under 25 years, the demographic groups most similar to Scottish are Immigrants from Bosnia and Herzegovina ($50,565, a difference of 0.020%), Slavic ($50,563, a difference of 0.020%), Immigrants from Cabo Verde ($50,520, a difference of 0.070%), Welsh ($50,597, a difference of 0.090%), and Immigrants from Africa ($50,609, a difference of 0.11%).
| Demographics | Rating | Rank | Householder Income Under 25 years |
| Cubans | 2.3 /100 | #242 | Tragic $50,655 |
| Immigrants | Thailand | 2.2 /100 | #243 | Tragic $50,645 |
| Marshallese | 2.1 /100 | #244 | Tragic $50,627 |
| Immigrants | Africa | 2.0 /100 | #245 | Tragic $50,609 |
| Welsh | 2.0 /100 | #246 | Tragic $50,597 |
| Immigrants | Bosnia and Herzegovina | 1.8 /100 | #247 | Tragic $50,565 |
| Slavs | 1.8 /100 | #248 | Tragic $50,563 |
| Scottish | 1.8 /100 | #249 | Tragic $50,554 |
| Immigrants | Cabo Verde | 1.7 /100 | #250 | Tragic $50,520 |
| Celtics | 1.4 /100 | #251 | Tragic $50,447 |
| Immigrants | Mexico | 1.3 /100 | #252 | Tragic $50,422 |
| Immigrants | Haiti | 1.2 /100 | #253 | Tragic $50,398 |
| Luxembourgers | 1.2 /100 | #254 | Tragic $50,379 |
| Aleuts | 1.2 /100 | #255 | Tragic $50,377 |
| Immigrants | Cuba | 1.2 /100 | #256 | Tragic $50,374 |