Navajo vs Central American Median Family Income
COMPARE
Navajo
Central American
Median Family Income
Median Family Income Comparison
Navajo
Central Americans
$70,989
MEDIAN FAMILY INCOME
0.0/ 100
METRIC RATING
345th/ 347
METRIC RANK
$91,087
MEDIAN FAMILY INCOME
0.3/ 100
METRIC RATING
266th/ 347
METRIC RANK
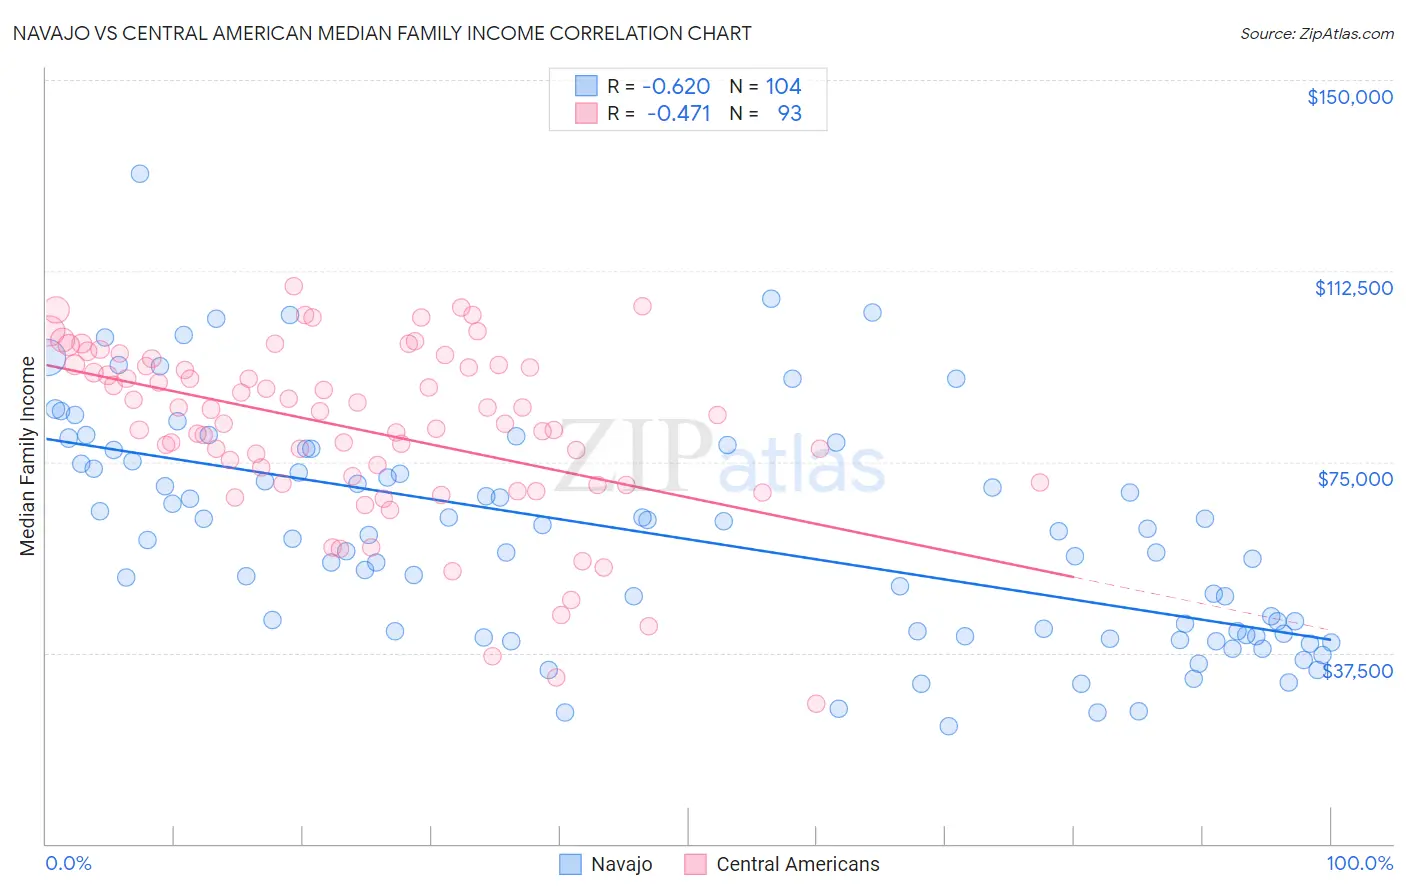
Navajo vs Central American Median Family Income Correlation Chart
The statistical analysis conducted on geographies consisting of 224,690,436 people shows a significant negative correlation between the proportion of Navajo and median family income in the United States with a correlation coefficient (R) of -0.620 and weighted average of $70,989. Similarly, the statistical analysis conducted on geographies consisting of 503,776,524 people shows a moderate negative correlation between the proportion of Central Americans and median family income in the United States with a correlation coefficient (R) of -0.471 and weighted average of $91,087, a difference of 28.3%.
Median Family Income Correlation Summary
| Measurement | Navajo | Central American |
| Minimum | $22,955 | $27,406 |
| Maximum | $131,574 | $109,579 |
| Range | $108,619 | $82,173 |
| Mean | $60,376 | $81,381 |
| Median | $59,766 | $84,167 |
| Interquartile 25% (IQ1) | $41,038 | $70,836 |
| Interquartile 75% (IQ3) | $74,887 | $93,875 |
| Interquartile Range (IQR) | $33,849 | $23,039 |
| Standard Deviation (Sample) | $22,079 | $17,262 |
| Standard Deviation (Population) | $21,972 | $17,169 |
Similar Demographics by Median Family Income
Demographics Similar to Navajo by Median Family Income
In terms of median family income, the demographic groups most similar to Navajo are Puerto Rican ($70,423, a difference of 0.80%), Tohono O'odham ($72,193, a difference of 1.7%), Lumbee ($68,679, a difference of 3.4%), Houma ($76,188, a difference of 7.3%), and Crow ($76,605, a difference of 7.9%).
| Demographics | Rating | Rank | Median Family Income |
| Kiowa | 0.0 /100 | #333 | Tragic $80,885 |
| Menominee | 0.0 /100 | #334 | Tragic $79,563 |
| Yup'ik | 0.0 /100 | #335 | Tragic $79,290 |
| Immigrants | Cuba | 0.0 /100 | #336 | Tragic $78,249 |
| Yuman | 0.0 /100 | #337 | Tragic $78,055 |
| Immigrants | Yemen | 0.0 /100 | #338 | Tragic $77,457 |
| Pima | 0.0 /100 | #339 | Tragic $77,431 |
| Hopi | 0.0 /100 | #340 | Tragic $77,188 |
| Pueblo | 0.0 /100 | #341 | Tragic $76,880 |
| Crow | 0.0 /100 | #342 | Tragic $76,605 |
| Houma | 0.0 /100 | #343 | Tragic $76,188 |
| Tohono O'odham | 0.0 /100 | #344 | Tragic $72,193 |
| Navajo | 0.0 /100 | #345 | Tragic $70,989 |
| Puerto Ricans | 0.0 /100 | #346 | Tragic $70,423 |
| Lumbee | 0.0 /100 | #347 | Tragic $68,679 |
Demographics Similar to Central Americans by Median Family Income
In terms of median family income, the demographic groups most similar to Central Americans are Mexican American Indian ($90,918, a difference of 0.19%), Hmong ($91,296, a difference of 0.23%), Cree ($90,882, a difference of 0.23%), Belizean ($90,880, a difference of 0.23%), and Senegalese ($91,475, a difference of 0.43%).
| Demographics | Rating | Rank | Median Family Income |
| Cape Verdeans | 0.4 /100 | #259 | Tragic $91,848 |
| Pennsylvania Germans | 0.4 /100 | #260 | Tragic $91,763 |
| Inupiat | 0.4 /100 | #261 | Tragic $91,730 |
| Liberians | 0.4 /100 | #262 | Tragic $91,722 |
| Immigrants | West Indies | 0.3 /100 | #263 | Tragic $91,588 |
| Senegalese | 0.3 /100 | #264 | Tragic $91,475 |
| Hmong | 0.3 /100 | #265 | Tragic $91,296 |
| Central Americans | 0.3 /100 | #266 | Tragic $91,087 |
| Mexican American Indians | 0.2 /100 | #267 | Tragic $90,918 |
| Cree | 0.2 /100 | #268 | Tragic $90,882 |
| Belizeans | 0.2 /100 | #269 | Tragic $90,880 |
| Jamaicans | 0.2 /100 | #270 | Tragic $90,581 |
| Iroquois | 0.2 /100 | #271 | Tragic $90,543 |
| Immigrants | Liberia | 0.2 /100 | #272 | Tragic $90,450 |
| Immigrants | Micronesia | 0.2 /100 | #273 | Tragic $90,345 |