Native Hawaiian vs Immigrants from Hungary Householder Income Ages 45 - 64 years
COMPARE
Native Hawaiian
Immigrants from Hungary
Householder Income Ages 45 - 64 years
Householder Income Ages 45 - 64 years Comparison
Native Hawaiians
Immigrants from Hungary
$105,149
HOUSEHOLDER INCOME AGES 45 - 64 YEARS
91.8/ 100
METRIC RATING
128th/ 347
METRIC RANK
$108,267
HOUSEHOLDER INCOME AGES 45 - 64 YEARS
98.2/ 100
METRIC RATING
95th/ 347
METRIC RANK
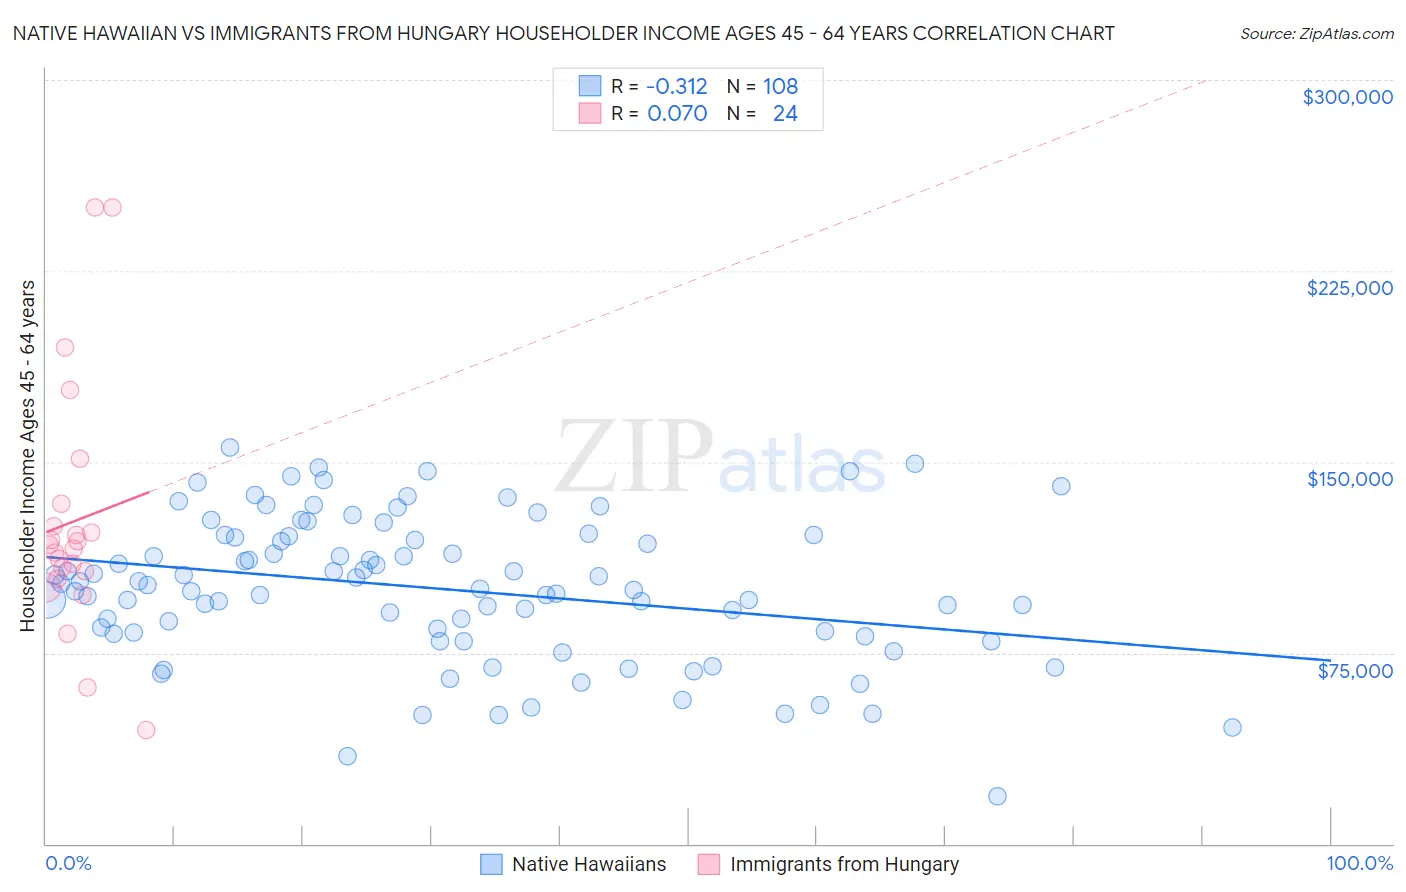
Native Hawaiian vs Immigrants from Hungary Householder Income Ages 45 - 64 years Correlation Chart
The statistical analysis conducted on geographies consisting of 331,465,434 people shows a mild negative correlation between the proportion of Native Hawaiians and household income with householder between the ages 45 and 64 in the United States with a correlation coefficient (R) of -0.312 and weighted average of $105,149. Similarly, the statistical analysis conducted on geographies consisting of 195,542,258 people shows a slight positive correlation between the proportion of Immigrants from Hungary and household income with householder between the ages 45 and 64 in the United States with a correlation coefficient (R) of 0.070 and weighted average of $108,267, a difference of 3.0%.
Householder Income Ages 45 - 64 years Correlation Summary
| Measurement | Native Hawaiian | Immigrants from Hungary |
| Minimum | $18,640 | $44,685 |
| Maximum | $155,705 | $250,001 |
| Range | $137,065 | $205,316 |
| Mean | $100,121 | $126,709 |
| Median | $101,051 | $116,767 |
| Interquartile 25% (IQ1) | $82,658 | $105,544 |
| Interquartile 75% (IQ3) | $120,563 | $129,142 |
| Interquartile Range (IQR) | $37,905 | $23,598 |
| Standard Deviation (Sample) | $28,044 | $48,913 |
| Standard Deviation (Population) | $27,914 | $47,884 |
Similar Demographics by Householder Income Ages 45 - 64 years
Demographics Similar to Native Hawaiians by Householder Income Ages 45 - 64 years
In terms of householder income ages 45 - 64 years, the demographic groups most similar to Native Hawaiians are Peruvian ($105,070, a difference of 0.080%), Immigrants from Saudi Arabia ($105,249, a difference of 0.090%), Portuguese ($105,309, a difference of 0.15%), Immigrants from Zimbabwe ($104,992, a difference of 0.15%), and Pakistani ($105,317, a difference of 0.16%).
| Demographics | Rating | Rank | Householder Income Ages 45 - 64 years |
| Poles | 94.4 /100 | #121 | Exceptional $105,952 |
| Immigrants | North Macedonia | 94.2 /100 | #122 | Exceptional $105,892 |
| Danes | 93.4 /100 | #123 | Exceptional $105,619 |
| Immigrants | Northern Africa | 92.8 /100 | #124 | Exceptional $105,430 |
| Pakistanis | 92.4 /100 | #125 | Exceptional $105,317 |
| Portuguese | 92.4 /100 | #126 | Exceptional $105,309 |
| Immigrants | Saudi Arabia | 92.2 /100 | #127 | Exceptional $105,249 |
| Native Hawaiians | 91.8 /100 | #128 | Exceptional $105,149 |
| Peruvians | 91.5 /100 | #129 | Exceptional $105,070 |
| Immigrants | Zimbabwe | 91.2 /100 | #130 | Exceptional $104,992 |
| Immigrants | Syria | 90.7 /100 | #131 | Exceptional $104,858 |
| Lebanese | 90.1 /100 | #132 | Exceptional $104,734 |
| Arabs | 89.3 /100 | #133 | Excellent $104,566 |
| Canadians | 89.3 /100 | #134 | Excellent $104,560 |
| Brazilians | 88.6 /100 | #135 | Excellent $104,408 |
Demographics Similar to Immigrants from Hungary by Householder Income Ages 45 - 64 years
In terms of householder income ages 45 - 64 years, the demographic groups most similar to Immigrants from Hungary are Sri Lankan ($108,270, a difference of 0.0%), Immigrants from Argentina ($108,264, a difference of 0.0%), Immigrants from Croatia ($108,304, a difference of 0.030%), Croatian ($108,383, a difference of 0.11%), and Ukrainian ($108,475, a difference of 0.19%).
| Demographics | Rating | Rank | Householder Income Ages 45 - 64 years |
| Romanians | 98.5 /100 | #88 | Exceptional $108,609 |
| Ukrainians | 98.3 /100 | #89 | Exceptional $108,475 |
| Immigrants | Philippines | 98.3 /100 | #90 | Exceptional $108,471 |
| Immigrants | Lebanon | 98.3 /100 | #91 | Exceptional $108,471 |
| Croatians | 98.3 /100 | #92 | Exceptional $108,383 |
| Immigrants | Croatia | 98.2 /100 | #93 | Exceptional $108,304 |
| Sri Lankans | 98.2 /100 | #94 | Exceptional $108,270 |
| Immigrants | Hungary | 98.2 /100 | #95 | Exceptional $108,267 |
| Immigrants | Argentina | 98.2 /100 | #96 | Exceptional $108,264 |
| Northern Europeans | 97.8 /100 | #97 | Exceptional $107,870 |
| Immigrants | Southern Europe | 97.7 /100 | #98 | Exceptional $107,775 |
| Palestinians | 97.6 /100 | #99 | Exceptional $107,721 |
| Immigrants | Serbia | 97.4 /100 | #100 | Exceptional $107,569 |
| Immigrants | Kazakhstan | 97.2 /100 | #101 | Exceptional $107,378 |
| Immigrants | Moldova | 97.1 /100 | #102 | Exceptional $107,357 |