Native Hawaiian vs Alaska Native Median Female Earnings
COMPARE
Native Hawaiian
Alaska Native
Median Female Earnings
Median Female Earnings Comparison
Native Hawaiians
Alaska Natives
$38,461
MEDIAN FEMALE EARNINGS
7.1/ 100
METRIC RATING
224th/ 347
METRIC RANK
$38,202
MEDIAN FEMALE EARNINGS
4.3/ 100
METRIC RATING
238th/ 347
METRIC RANK
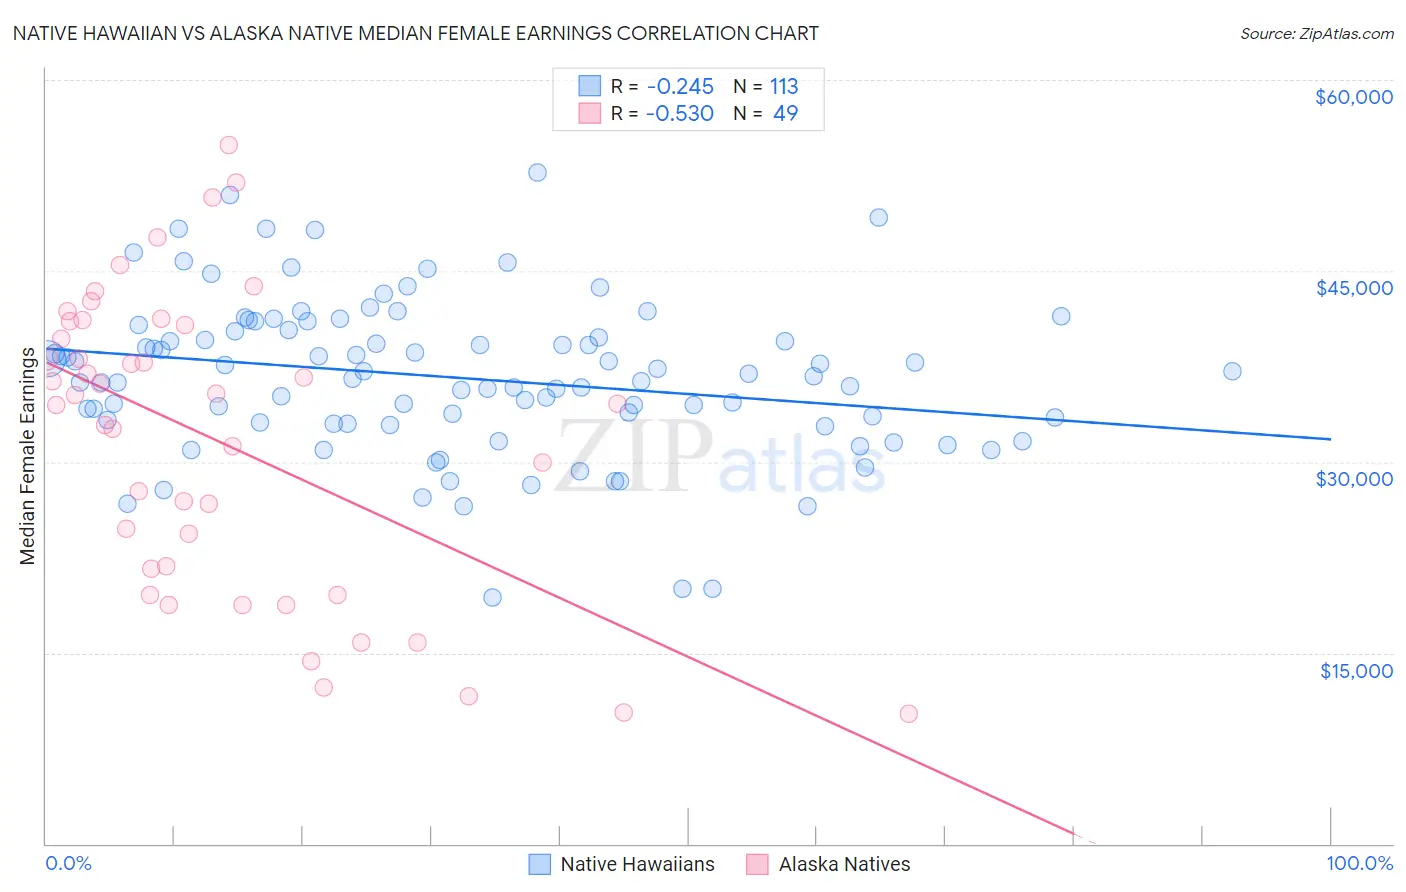
Native Hawaiian vs Alaska Native Median Female Earnings Correlation Chart
The statistical analysis conducted on geographies consisting of 331,982,938 people shows a weak negative correlation between the proportion of Native Hawaiians and median female earnings in the United States with a correlation coefficient (R) of -0.245 and weighted average of $38,461. Similarly, the statistical analysis conducted on geographies consisting of 76,744,414 people shows a substantial negative correlation between the proportion of Alaska Natives and median female earnings in the United States with a correlation coefficient (R) of -0.530 and weighted average of $38,202, a difference of 0.68%.
Median Female Earnings Correlation Summary
| Measurement | Native Hawaiian | Alaska Native |
| Minimum | $19,330 | $10,250 |
| Maximum | $52,779 | $54,922 |
| Range | $33,449 | $44,672 |
| Mean | $36,634 | $31,635 |
| Median | $36,735 | $34,583 |
| Interquartile 25% (IQ1) | $33,052 | $20,573 |
| Interquartile 75% (IQ3) | $40,312 | $40,922 |
| Interquartile Range (IQR) | $7,259 | $20,349 |
| Standard Deviation (Sample) | $6,153 | $11,761 |
| Standard Deviation (Population) | $6,125 | $11,640 |
Demographics Similar to Native Hawaiians and Alaska Natives by Median Female Earnings
In terms of median female earnings, the demographic groups most similar to Native Hawaiians are French ($38,457, a difference of 0.010%), French Canadian ($38,436, a difference of 0.060%), Immigrants from Sudan ($38,511, a difference of 0.13%), Japanese ($38,528, a difference of 0.17%), and Scottish ($38,397, a difference of 0.17%). Similarly, the demographic groups most similar to Alaska Natives are Immigrants from Cabo Verde ($38,208, a difference of 0.020%), English ($38,196, a difference of 0.020%), Liberian ($38,215, a difference of 0.030%), Sudanese ($38,215, a difference of 0.040%), and Finnish ($38,173, a difference of 0.080%).
| Demographics | Rating | Rank | Median Female Earnings |
| Immigrants | Azores | 8.8 /100 | #221 | Tragic $38,573 |
| Japanese | 8.1 /100 | #222 | Tragic $38,528 |
| Immigrants | Sudan | 7.8 /100 | #223 | Tragic $38,511 |
| Native Hawaiians | 7.1 /100 | #224 | Tragic $38,461 |
| French | 7.0 /100 | #225 | Tragic $38,457 |
| French Canadians | 6.8 /100 | #226 | Tragic $38,436 |
| Scottish | 6.3 /100 | #227 | Tragic $38,397 |
| Sub-Saharan Africans | 6.2 /100 | #228 | Tragic $38,391 |
| Belgians | 6.1 /100 | #229 | Tragic $38,382 |
| Basques | 5.7 /100 | #230 | Tragic $38,352 |
| Somalis | 5.5 /100 | #231 | Tragic $38,333 |
| Scandinavians | 5.2 /100 | #232 | Tragic $38,306 |
| Tongans | 5.1 /100 | #233 | Tragic $38,288 |
| Celtics | 5.0 /100 | #234 | Tragic $38,283 |
| Sudanese | 4.4 /100 | #235 | Tragic $38,215 |
| Liberians | 4.4 /100 | #236 | Tragic $38,215 |
| Immigrants | Cabo Verde | 4.3 /100 | #237 | Tragic $38,208 |
| Alaska Natives | 4.3 /100 | #238 | Tragic $38,202 |
| English | 4.2 /100 | #239 | Tragic $38,196 |
| Finns | 4.0 /100 | #240 | Tragic $38,173 |
| Spanish | 3.5 /100 | #241 | Tragic $38,098 |