Moroccan vs Immigrants from Latin America Householder Income Under 25 years
COMPARE
Moroccan
Immigrants from Latin America
Householder Income Under 25 years
Householder Income Under 25 years Comparison
Moroccans
Immigrants from Latin America
$53,256
HOUSEHOLDER INCOME UNDER 25 YEARS
93.1/ 100
METRIC RATING
132nd/ 347
METRIC RANK
$51,387
HOUSEHOLDER INCOME UNDER 25 YEARS
12.3/ 100
METRIC RATING
206th/ 347
METRIC RANK
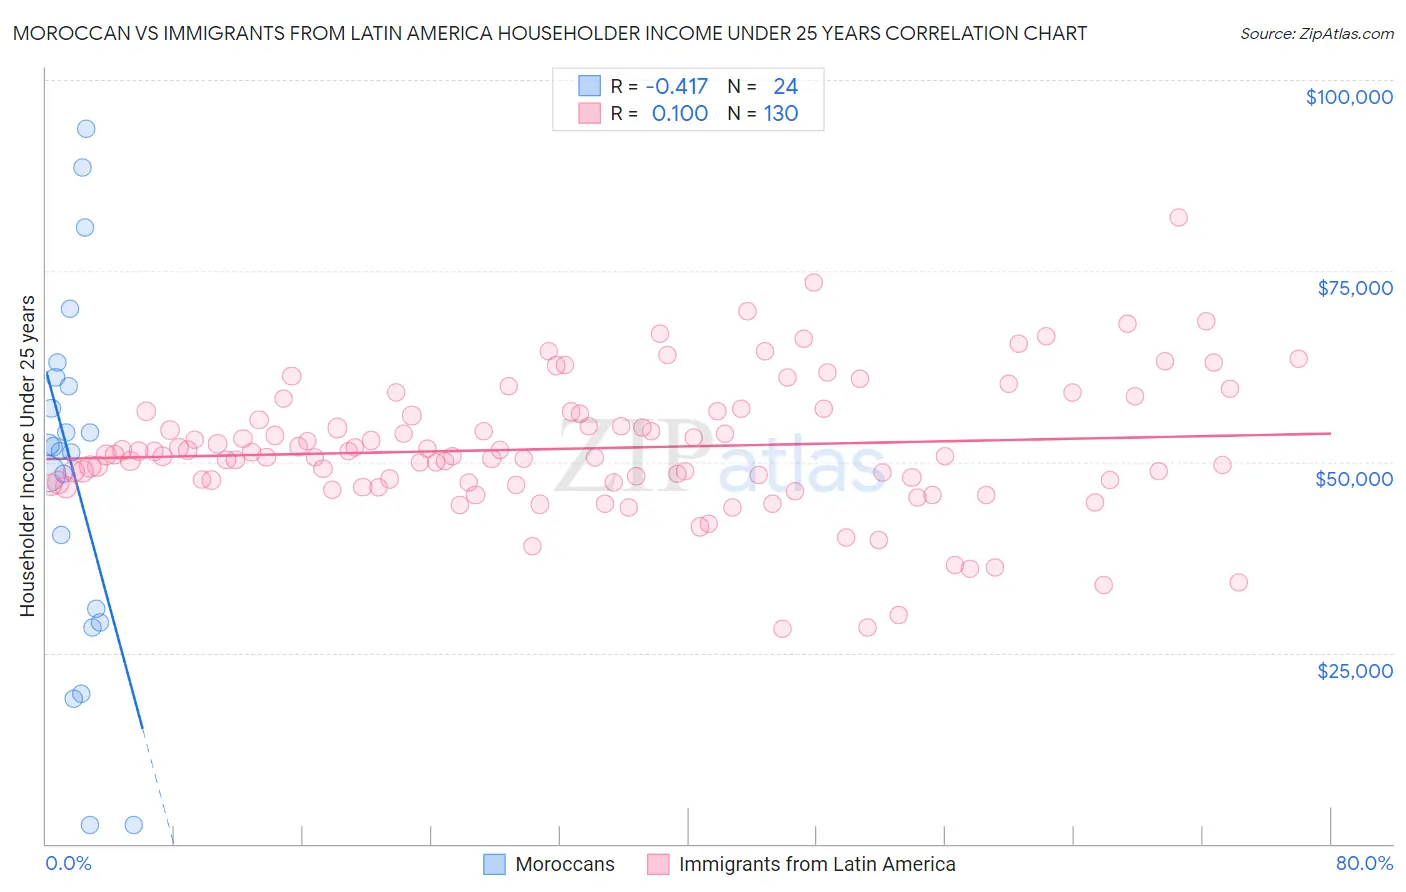
Moroccan vs Immigrants from Latin America Householder Income Under 25 years Correlation Chart
The statistical analysis conducted on geographies consisting of 180,752,865 people shows a moderate negative correlation between the proportion of Moroccans and household income with householder under the age of 25 in the United States with a correlation coefficient (R) of -0.417 and weighted average of $53,256. Similarly, the statistical analysis conducted on geographies consisting of 435,231,480 people shows a poor positive correlation between the proportion of Immigrants from Latin America and household income with householder under the age of 25 in the United States with a correlation coefficient (R) of 0.100 and weighted average of $51,387, a difference of 3.6%.
Householder Income Under 25 years Correlation Summary
| Measurement | Moroccan | Immigrants from Latin America |
| Minimum | $2,499 | $28,148 |
| Maximum | $93,569 | $82,039 |
| Range | $91,070 | $53,891 |
| Mean | $48,217 | $51,773 |
| Median | $51,677 | $50,826 |
| Interquartile 25% (IQ1) | $29,861 | $47,269 |
| Interquartile 75% (IQ3) | $60,431 | $56,553 |
| Interquartile Range (IQR) | $30,570 | $9,284 |
| Standard Deviation (Sample) | $23,674 | $8,698 |
| Standard Deviation (Population) | $23,176 | $8,665 |
Similar Demographics by Householder Income Under 25 years
Demographics Similar to Moroccans by Householder Income Under 25 years
In terms of householder income under 25 years, the demographic groups most similar to Moroccans are Immigrants from Nicaragua ($53,266, a difference of 0.020%), Nicaraguan ($53,275, a difference of 0.030%), New Zealander ($53,294, a difference of 0.070%), Immigrants from Bulgaria ($53,305, a difference of 0.090%), and Immigrants from North America ($53,307, a difference of 0.10%).
| Demographics | Rating | Rank | Householder Income Under 25 years |
| Pakistanis | 94.1 /100 | #125 | Exceptional $53,325 |
| Immigrants | Serbia | 94.1 /100 | #126 | Exceptional $53,321 |
| Immigrants | North America | 93.9 /100 | #127 | Exceptional $53,307 |
| Immigrants | Bulgaria | 93.9 /100 | #128 | Exceptional $53,305 |
| New Zealanders | 93.7 /100 | #129 | Exceptional $53,294 |
| Nicaraguans | 93.4 /100 | #130 | Exceptional $53,275 |
| Immigrants | Nicaragua | 93.3 /100 | #131 | Exceptional $53,266 |
| Moroccans | 93.1 /100 | #132 | Exceptional $53,256 |
| Immigrants | Immigrants | 92.2 /100 | #133 | Exceptional $53,201 |
| Immigrants | Northern Africa | 91.9 /100 | #134 | Exceptional $53,185 |
| Chileans | 91.9 /100 | #135 | Exceptional $53,185 |
| Armenians | 91.8 /100 | #136 | Exceptional $53,179 |
| Immigrants | Barbados | 91.5 /100 | #137 | Exceptional $53,163 |
| Norwegians | 90.8 /100 | #138 | Exceptional $53,127 |
| Costa Ricans | 90.4 /100 | #139 | Exceptional $53,106 |
Demographics Similar to Immigrants from Latin America by Householder Income Under 25 years
In terms of householder income under 25 years, the demographic groups most similar to Immigrants from Latin America are Cape Verdean ($51,387, a difference of 0.0%), South African ($51,383, a difference of 0.010%), Immigrants from Jordan ($51,370, a difference of 0.030%), Czech ($51,421, a difference of 0.070%), and Syrian ($51,353, a difference of 0.070%).
| Demographics | Rating | Rank | Householder Income Under 25 years |
| Swiss | 15.4 /100 | #199 | Poor $51,493 |
| Immigrants | West Indies | 14.9 /100 | #200 | Poor $51,479 |
| British | 14.9 /100 | #201 | Poor $51,477 |
| Immigrants | Guatemala | 14.0 /100 | #202 | Poor $51,447 |
| Immigrants | Cameroon | 13.6 /100 | #203 | Poor $51,433 |
| Czechs | 13.2 /100 | #204 | Poor $51,421 |
| Cape Verdeans | 12.3 /100 | #205 | Poor $51,387 |
| Immigrants | Latin America | 12.3 /100 | #206 | Poor $51,387 |
| South Africans | 12.2 /100 | #207 | Poor $51,383 |
| Immigrants | Jordan | 11.9 /100 | #208 | Poor $51,370 |
| Syrians | 11.4 /100 | #209 | Poor $51,353 |
| Immigrants | Ghana | 10.9 /100 | #210 | Poor $51,333 |
| Irish | 10.6 /100 | #211 | Poor $51,317 |
| Immigrants | Panama | 9.7 /100 | #212 | Tragic $51,278 |
| Dutch | 9.4 /100 | #213 | Tragic $51,265 |